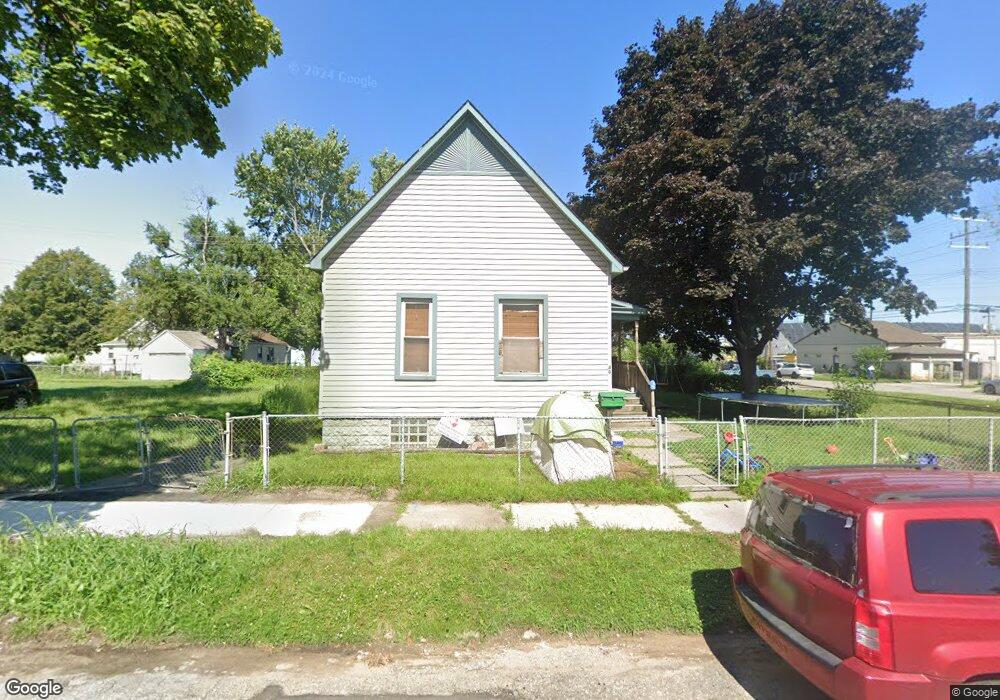
146 Charles St River Rouge, MI 48218
Estimated Value: $77,000 - $93,983
--
Bed
--
Bath
896
Sq Ft
$97/Sq Ft
Est. Value
About This Home
This home is located at 146 Charles St, River Rouge, MI 48218 and is currently estimated at $86,496, approximately $96 per square foot. 146 Charles St is a home located in Wayne County with nearby schools including Ann Visger K-5 Preparatory Academy.
Ownership History
Date
Name
Owned For
Owner Type
Purchase Details
Closed on
Jun 30, 2020
Sold by
Griffin Javon
Bought by
Maximum Investments Llc
Current Estimated Value
Purchase Details
Closed on
Jan 14, 2008
Sold by
Turner Pharoah A
Bought by
Griffin Javon
Purchase Details
Closed on
Dec 28, 2007
Sold by
Fannie Mae
Bought by
Turner Pharoah
Purchase Details
Closed on
Jul 28, 2006
Sold by
Everhome Mortgage Co
Bought by
Federal National Mortgage Association
Purchase Details
Closed on
Jul 27, 2006
Sold by
Scott Charles
Bought by
Everhome Mortgage Co
Create a Home Valuation Report for This Property
The Home Valuation Report is an in-depth analysis detailing your home's value as well as a comparison with similar homes in the area
Home Values in the Area
Average Home Value in this Area
Purchase History
| Date | Buyer | Sale Price | Title Company |
|---|---|---|---|
| Maximum Investments Llc | $8,500 | None Available | |
| Griffin Javon | -- | None Available | |
| Turner Pharoah | $1,000 | Greco | |
| Federal National Mortgage Association | -- | None Available | |
| Everhome Mortgage Co | $53,021 | None Available |
Source: Public Records
Tax History Compared to Growth
Tax History
| Year | Tax Paid | Tax Assessment Tax Assessment Total Assessment is a certain percentage of the fair market value that is determined by local assessors to be the total taxable value of land and additions on the property. | Land | Improvement |
|---|---|---|---|---|
| 2025 | $1,236 | $35,400 | $0 | $0 |
| 2024 | $1,236 | $30,300 | $0 | $0 |
| 2023 | $1,178 | $23,800 | $0 | $0 |
| 2022 | $1,638 | $18,500 | $0 | $0 |
| 2021 | $4,452 | $15,800 | $0 | $0 |
| 2020 | $2,338 | $13,400 | $0 | $0 |
| 2019 | $1,348 | $12,100 | $0 | $0 |
| 2018 | $1,413 | $11,000 | $0 | $0 |
| 2017 | $712 | $11,200 | $0 | $0 |
| 2016 | $2,067 | $11,500 | $0 | $0 |
| 2015 | $1,410 | $14,100 | $0 | $0 |
| 2013 | $2,260 | $23,700 | $0 | $0 |
| 2012 | $2,488 | $23,200 | $3,700 | $19,500 |
Source: Public Records
Map
Nearby Homes