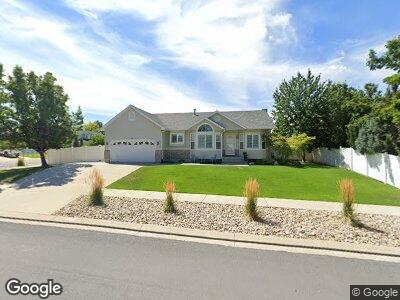
146 Cranberry Hill Dr Draper, UT 84020
Estimated Value: $628,000 - $878,000
4
Beds
3
Baths
2,800
Sq Ft
$252/Sq Ft
Est. Value
About This Home
This home is located at 146 Cranberry Hill Dr, Draper, UT 84020 and is currently estimated at $704,781, approximately $251 per square foot. 146 Cranberry Hill Dr is a home located in Salt Lake County with nearby schools including Crescent School, Mount Jordan Middle School, and American Preparatory Academy - Draper 2 Campus.
Ownership History
Date
Name
Owned For
Owner Type
Purchase Details
Closed on
Mar 24, 2010
Sold by
Wanke Steven J and Wanke Brenda C
Bought by
Wanke Steven James and Wanke Brenda Claire
Current Estimated Value
Purchase Details
Closed on
Jun 2, 2005
Sold by
Hogue Sean and Hogue Amy
Bought by
Wanke Steven J and Wanke Brenda C
Home Financials for this Owner
Home Financials are based on the most recent Mortgage that was taken out on this home.
Original Mortgage
$125,000
Interest Rate
5.74%
Mortgage Type
New Conventional
Purchase Details
Closed on
Sep 23, 1998
Sold by
Perry Homes Inc
Bought by
Hogue Sean and Hogue Amy
Home Financials for this Owner
Home Financials are based on the most recent Mortgage that was taken out on this home.
Original Mortgage
$170,628
Interest Rate
6.88%
Create a Home Valuation Report for This Property
The Home Valuation Report is an in-depth analysis detailing your home's value as well as a comparison with similar homes in the area
Home Values in the Area
Average Home Value in this Area
Purchase History
| Date | Buyer | Sale Price | Title Company |
|---|---|---|---|
| Wanke Steven James | -- | None Available | |
| Wanke Steven J | -- | Meridian Title | |
| Hogue Sean | -- | -- | |
| Perry Homes Inc | -- | -- |
Source: Public Records
Mortgage History
| Date | Status | Borrower | Loan Amount |
|---|---|---|---|
| Open | Wanke Stevn James | $97,052 | |
| Closed | Wanke Steven James | $113,014 | |
| Closed | Wanke Steven J | $125,000 | |
| Previous Owner | Hogue Sean | $170,628 |
Source: Public Records
Tax History Compared to Growth
Tax History
| Year | Tax Paid | Tax Assessment Tax Assessment Total Assessment is a certain percentage of the fair market value that is determined by local assessors to be the total taxable value of land and additions on the property. | Land | Improvement |
|---|---|---|---|---|
| 2023 | $2,916 | $551,600 | $210,500 | $341,100 |
| 2022 | $3,088 | $564,300 | $206,300 | $358,000 |
| 2021 | $2,636 | $411,300 | $194,400 | $216,900 |
| 2020 | $2,478 | $366,600 | $180,000 | $186,600 |
| 2019 | $2,470 | $357,000 | $180,000 | $177,000 |
| 2018 | $2,312 | $341,500 | $180,000 | $161,500 |
| 2017 | $2,300 | $325,500 | $171,300 | $154,200 |
| 2016 | $2,288 | $314,600 | $164,700 | $149,900 |
| 2015 | $2,486 | $316,500 | $168,000 | $148,500 |
| 2014 | $2,321 | $288,600 | $154,800 | $133,800 |
Source: Public Records
Map
Nearby Homes
- 208 Crescentwood Dr
- 11544 S Ginger Root Ct
- 11278 Jordan Meadow Ln Unit 185
- 372 Brambleberry Ln
- 11255 S Jordan View Dr Unit 43
- 11259 S Crescent Park Cir Unit 172
- 334 E La Vera Ln
- 11519 Honey Locust Ct
- 11751 S Danta Dr
- 82 Danta Dr S
- 82 E Danta Dr
- 11773 S Twin Pines Ct
- 11243 Hidden View Dr Unit 122
- 11834 S Cottage View Ln
- 11855 Cottage Side Way
- 11298 S 605 E
- 11959 S 235 E
- 65 S 11000
- 65 E 11000 S
- 11717 S Shadow View Ln
- 146 Cranberry Hill Dr
- 11522 Olive Berry Ln
- 11501 S Sugar Berry Rd
- 11501 Sugar Berry Rd
- 11511 Sugar Berry Rd
- 11511 S Sugar Berry Rd
- 11484 S 150 E
- 11513 S Olive Berry Ln
- 11513 Olive Berry Ln
- 11532 Olive Berry Ln
- 11532 S Olive Berry Ln
- 11523 Olive Berry Ln
- 11479 Raspberry Ct
- 183 Cranberry Hill Dr
- 11519 Sugar Berry Rd
- 11519 S Sugar Berry Rd
- 11535 Olive Berry Ln
- 11535 S Olive Berry Ln
- 196 Cranberry Hill Dr
- 11544 Olive Berry Ln