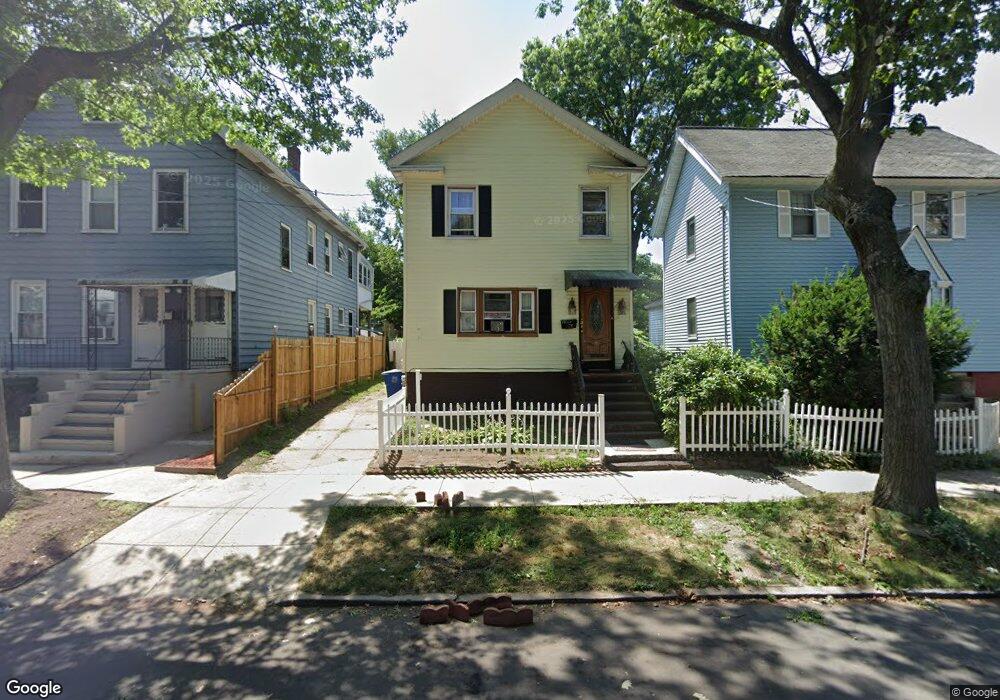
146 Dover St Unit 150 New Haven, CT 06513
Fair Haven NeighborhoodEstimated Value: $280,056 - $329,000
4
Beds
2
Baths
1,200
Sq Ft
$254/Sq Ft
Est. Value
About This Home
This home is located at 146 Dover St Unit 150, New Haven, CT 06513 and is currently estimated at $304,764, approximately $253 per square foot. 146 Dover St Unit 150 is a home located in New Haven County with nearby schools including Clinton Avenue School, Elm City College Preparatory School, and St Francis & St Rose Of Lima School.
Ownership History
Date
Name
Owned For
Owner Type
Purchase Details
Closed on
Oct 8, 2009
Sold by
Maynard Glaston
Bought by
Maynard Glaston and Mcgee Ernestine
Current Estimated Value
Purchase Details
Closed on
Mar 11, 1996
Sold by
New Haven Savings Bank
Bought by
Dellacamera Tatiana
Home Financials for this Owner
Home Financials are based on the most recent Mortgage that was taken out on this home.
Original Mortgage
$46,800
Interest Rate
7.39%
Create a Home Valuation Report for This Property
The Home Valuation Report is an in-depth analysis detailing your home's value as well as a comparison with similar homes in the area
Home Values in the Area
Average Home Value in this Area
Purchase History
| Date | Buyer | Sale Price | Title Company |
|---|---|---|---|
| Maynard Glaston | -- | -- | |
| Dellacamera Tatiana | $10,000 | -- |
Source: Public Records
Mortgage History
| Date | Status | Borrower | Loan Amount |
|---|---|---|---|
| Previous Owner | Dellacamera Tatiana | $52,500 | |
| Previous Owner | Dellacamera Tatiana | $46,800 | |
| Previous Owner | Dellacamera Tatiana | $53,000 |
Source: Public Records
Tax History Compared to Growth
Tax History
| Year | Tax Paid | Tax Assessment Tax Assessment Total Assessment is a certain percentage of the fair market value that is determined by local assessors to be the total taxable value of land and additions on the property. | Land | Improvement |
|---|---|---|---|---|
| 2025 | $4,766 | $120,960 | $43,400 | $77,560 |
| 2024 | $4,657 | $120,960 | $43,400 | $77,560 |
| 2023 | $4,500 | $120,960 | $43,400 | $77,560 |
| 2022 | $4,808 | $120,960 | $43,400 | $77,560 |
| 2021 | $4,021 | $91,630 | $30,520 | $61,110 |
| 2020 | $4,021 | $91,630 | $30,520 | $61,110 |
| 2019 | $3,938 | $91,630 | $30,520 | $61,110 |
| 2018 | $3,938 | $91,630 | $30,520 | $61,110 |
| 2017 | $3,544 | $91,630 | $30,520 | $61,110 |
| 2016 | $3,577 | $86,100 | $26,390 | $59,710 |
| 2015 | $3,577 | $86,100 | $26,390 | $59,710 |
| 2014 | $3,577 | $86,100 | $26,390 | $59,710 |
Source: Public Records
Map
Nearby Homes