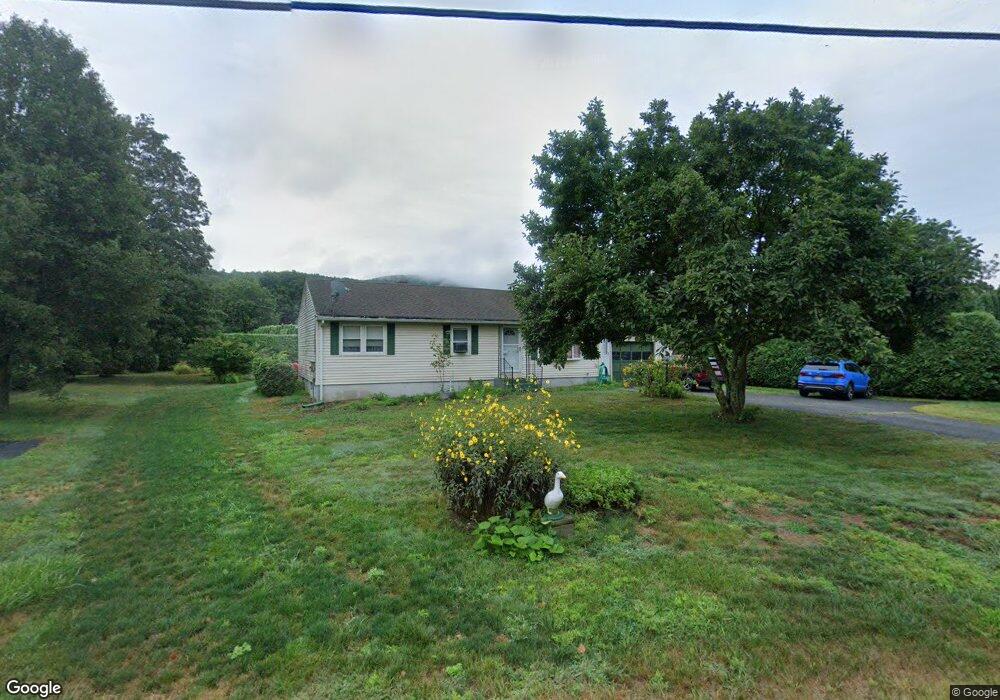
146 Ferry St Easthampton, MA 01027
Estimated Value: $363,000 - $433,000
3
Beds
2
Baths
1,092
Sq Ft
$366/Sq Ft
Est. Value
About This Home
This home is located at 146 Ferry St, Easthampton, MA 01027 and is currently estimated at $399,804, approximately $366 per square foot. 146 Ferry St is a home located in Hampshire County with nearby schools including Easthampton High School, Hilltown Cooperative Charter Public School, and Tri-County Schools.
Ownership History
Date
Name
Owned For
Owner Type
Purchase Details
Closed on
Oct 19, 2011
Sold by
Zaraya Jack D and Zaraya Raymond J
Bought by
Leibold Mark D and Haney Jacqueline
Current Estimated Value
Home Financials for this Owner
Home Financials are based on the most recent Mortgage that was taken out on this home.
Original Mortgage
$145,200
Outstanding Balance
$99,271
Interest Rate
4.15%
Mortgage Type
Purchase Money Mortgage
Estimated Equity
$300,533
Create a Home Valuation Report for This Property
The Home Valuation Report is an in-depth analysis detailing your home's value as well as a comparison with similar homes in the area
Home Values in the Area
Average Home Value in this Area
Purchase History
| Date | Buyer | Sale Price | Title Company |
|---|---|---|---|
| Leibold Mark D | $181,500 | -- |
Source: Public Records
Mortgage History
| Date | Status | Borrower | Loan Amount |
|---|---|---|---|
| Open | Leibold Mark D | $145,200 |
Source: Public Records
Tax History
| Year | Tax Paid | Tax Assessment Tax Assessment Total Assessment is a certain percentage of the fair market value that is determined by local assessors to be the total taxable value of land and additions on the property. | Land | Improvement |
|---|---|---|---|---|
| 2025 | $5,129 | $375,200 | $110,100 | $265,100 |
| 2024 | $4,430 | $326,700 | $106,900 | $219,800 |
| 2023 | $3,355 | $229,000 | $84,300 | $144,700 |
| 2022 | $3,785 | $229,000 | $84,300 | $144,700 |
| 2021 | $4,143 | $236,200 | $84,300 | $151,900 |
| 2020 | $4,067 | $229,000 | $84,300 | $144,700 |
| 2019 | $3,406 | $220,300 | $84,300 | $136,000 |
| 2018 | $3,525 | $220,300 | $79,500 | $140,800 |
| 2017 | $3,443 | $212,400 | $76,500 | $135,900 |
| 2016 | $3,311 | $212,400 | $76,500 | $135,900 |
| 2015 | $3,218 | $212,400 | $76,500 | $135,900 |
Source: Public Records
Map
Nearby Homes
- 29 Parsons St Unit 1
- 18-20 Oakdale Place
- 10 Glen Cove Place Unit A
- 12 Glen Cove Place Unit B
- 2 Oak St
- 33 Knipfer Ave
- 40 Clark St
- 4 Gaugh St
- 19 Nicols Way Unit 19
- 7 Union Ct
- 11 Dragon Cir
- 26 Winter St
- 641 Northampton St
- 296 Old Wilson Rd
- 18 Cedar St
- Lot 1 Edgewater Ln
- 967 Florence Rd
- 6 Wilton Rd
- 283 South St
- 385 Main St
Your Personal Tour Guide
Ask me questions while you tour the home.