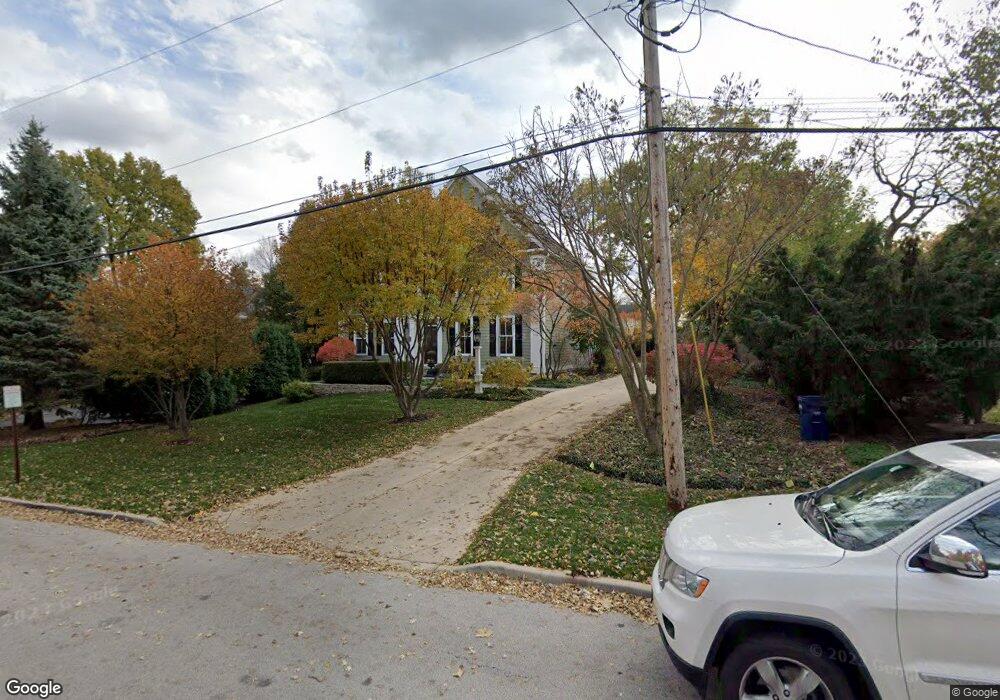
146 Franklin St Geneva, IL 60134
Downtown Geneva NeighborhoodEstimated Value: $1,353,000 - $1,561,000
3
Beds
5
Baths
4,699
Sq Ft
$313/Sq Ft
Est. Value
About This Home
This home is located at 146 Franklin St, Geneva, IL 60134 and is currently estimated at $1,468,887, approximately $312 per square foot. 146 Franklin St is a home located in Kane County with nearby schools including Williamsburg Elementary School, Geneva Community High School, and St. Peter School.
Ownership History
Date
Name
Owned For
Owner Type
Purchase Details
Closed on
Oct 5, 2020
Sold by
Murphy James P and Murphy Lori C
Bought by
Dragisic Nick J and Kahn Katherine E
Current Estimated Value
Home Financials for this Owner
Home Financials are based on the most recent Mortgage that was taken out on this home.
Original Mortgage
$748,388
Outstanding Balance
$665,651
Interest Rate
2.9%
Mortgage Type
New Conventional
Estimated Equity
$803,236
Purchase Details
Closed on
Sep 12, 1997
Sold by
Heinz Ken
Bought by
Murphy James P and Murphy Lori C
Home Financials for this Owner
Home Financials are based on the most recent Mortgage that was taken out on this home.
Original Mortgage
$210,000
Interest Rate
7.55%
Purchase Details
Closed on
Sep 26, 1996
Sold by
Hallahn James C
Bought by
Heinz Ken
Create a Home Valuation Report for This Property
The Home Valuation Report is an in-depth analysis detailing your home's value as well as a comparison with similar homes in the area
Home Values in the Area
Average Home Value in this Area
Purchase History
| Date | Buyer | Sale Price | Title Company |
|---|---|---|---|
| Dragisic Nick J | $1,059,500 | Attorney | |
| Murphy James P | $366,000 | Chicago Title Insurance Co | |
| Heinz Ken | $125,000 | Chicago Title Insurance Co |
Source: Public Records
Mortgage History
| Date | Status | Borrower | Loan Amount |
|---|---|---|---|
| Open | Dragisic Nick J | $748,388 | |
| Previous Owner | Murphy James P | $210,000 |
Source: Public Records
Tax History Compared to Growth
Tax History
| Year | Tax Paid | Tax Assessment Tax Assessment Total Assessment is a certain percentage of the fair market value that is determined by local assessors to be the total taxable value of land and additions on the property. | Land | Improvement |
|---|---|---|---|---|
| 2024 | $32,227 | $431,529 | $48,827 | $382,702 |
| 2023 | $31,528 | $392,299 | $44,388 | $347,911 |
| 2022 | $29,935 | $364,522 | $41,245 | $323,277 |
| 2021 | $29,094 | $350,974 | $39,712 | $311,262 |
| 2020 | $23,239 | $280,266 | $39,106 | $241,160 |
| 2019 | $23,191 | $274,960 | $38,366 | $236,594 |
| 2018 | $23,158 | $274,960 | $38,366 | $236,594 |
| 2017 | $22,917 | $267,627 | $37,343 | $230,284 |
| 2016 | $23,041 | $264,010 | $36,838 | $227,172 |
| 2015 | -- | $251,008 | $35,024 | $215,984 |
| 2014 | -- | $238,590 | $35,024 | $203,566 |
| 2013 | -- | $238,590 | $35,024 | $203,566 |
Source: Public Records
Map
Nearby Homes
- 108 S River Ln
- 315 S 5th St
- 213 S 5th St
- 228 Crissey Ave
- 413 Cheever Ave
- 57 S 7th St
- Lot 31 Fox Run Dr
- 221 Campbell Ct
- 246 Kenston Ct Unit 246
- 515 Peyton St
- 771 Fox Run Dr
- 747 Cheever Ave
- 615 Easton Ave
- 710 Peck Rd
- 1211 James St
- 501 Dodson St
- 518 Illinois St
- 301 Country Club Place
- 1301 S Batavia Ave
- LOT 209 Austin Ave