
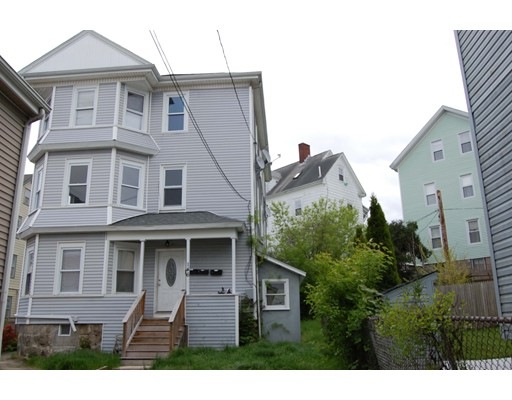
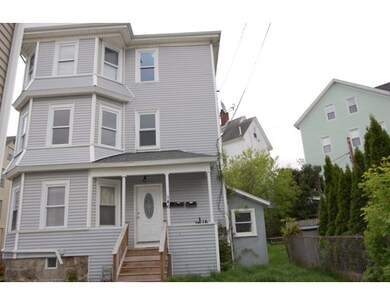
146 Hunter St Fall River, MA 02721
Sandy Beach Neighborhood
9
Beds
3
Baths
3,141
Sq Ft
3,485
Sq Ft Lot
About This Home
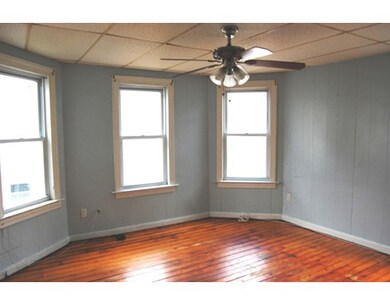
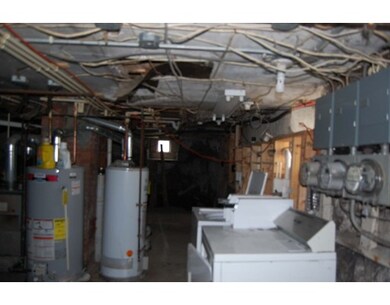
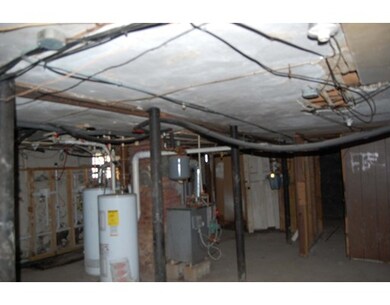
As of June 20203 Family with 3 bedrooms in each unit. Great opportunity for investors or owner-occupied. This house has a newer roof and porch. Plumbing updates and 2nd floor open for a buyer that wants to owner-occupy the property. Property is easy to show. MOTIVATED SELLER!
Property Details
Home Type
Multi-Family
Est. Annual Taxes
$4,304
Year Built
1900
Lot Details
0
Listing Details
- Lot Description: Other (See Remarks)
- Property Type: Multi-family
- Other Agent: 2.00
- Lead Paint: Certified Treated
- Year Round: Yes
- Year Built Description: Actual
- Special Features: None
- Property Sub Type: MultiFamily
- Year Built: 1900
Interior Features
- Has Basement: Yes
- Number of Rooms: 15
- Amenities: Public Transportation, Shopping, Park, Medical Facility, Laundromat, Public School
- Electric: 110 Volts, 60 Amps/Less, Individually Metered
- Energy: Insulated Windows
- Flooring: Wood, Vinyl, Wall to Wall Carpet
- Basement: Full
- Full Bathrooms: 3
- Total Levels: 3
- Main Lo: AN3354
- Main So: BB2685
- Estimated Sq Ft: 3141.00
Exterior Features
- Construction: Frame
- Exterior: Vinyl
- Exterior Features: Porch, Gutters, Fenced Yard
- Foundation: Fieldstone
Utilities
- Heat Zones: 3
- Hot Water: Natural Gas
- Sewer: City/Town Sewer
- Water: City/Town Water
- Electric: 500
Condo/Co-op/Association
- Total Units: 3
Lot Info
- Assessor Parcel Number: M:0I-07 B:0000 L:0103
- Zoning: A-2
- Acre: 0.08
- Lot Size: 3309.00
Multi Family
- Foundation: 30x35
- Heat Units: 3
- Total Bedrooms: 9
- Total Floors: 6
- Total Full Baths: 3
- Total Levels: 3
- Total Rms: 15
- Multi Family Type: 3 Family
Ownership History
Date
Name
Owned For
Owner Type
Purchase Details
Closed on
May 14, 2012
Sold by
Medeiros John
Bought by
Bank Of America Na
Purchase Details
Closed on
Oct 29, 2004
Sold by
Slayter David and Glynn Desmond
Bought by
Medeiros John
Home Financials for this Owner
Home Financials are based on the most recent Mortgage that was taken out on this home.
Original Mortgage
$190,000
Interest Rate
5.74%
Mortgage Type
Purchase Money Mortgage
Purchase Details
Closed on
Dec 31, 2003
Sold by
Brockway Adam and Austria Oliver B
Bought by
Slayter David and Glynn Desmond
Purchase Details
Closed on
May 23, 2003
Sold by
Hunter Rt
Bought by
Brockway Adam and Austria Oliver B
Purchase Details
Closed on
Jan 23, 2003
Sold by
Hunter Rt
Bought by
Rios Victor M and Davila Cynthia
Purchase Details
Closed on
Jul 8, 1999
Sold by
Souza Jospehine A
Bought by
Morris Irwin M and Santos John L
Similar Home in Fall River, MA
Create a Home Valuation Report for This Property
The Home Valuation Report is an in-depth analysis detailing your home's value as well as a comparison with similar homes in the area
Home Values in the Area
Average Home Value in this Area
Purchase History
| Date | Type | Sale Price | Title Company |
|---|---|---|---|
| Foreclosure Deed | $104,000 | -- | |
| Foreclosure Deed | $104,000 | -- | |
| Foreclosure Deed | $104,000 | -- | |
| Deed | $237,500 | -- | |
| Deed | $237,500 | -- | |
| Deed | $218,000 | -- | |
| Deed | $218,000 | -- | |
| Deed | $171,000 | -- | |
| Deed | $171,000 | -- | |
| Deed | $229,260 | -- | |
| Deed | $229,260 | -- | |
| Deed | $130,000 | -- | |
| Deed | $130,000 | -- |
Source: Public Records
Mortgage History
| Date | Status | Loan Amount | Loan Type |
|---|---|---|---|
| Previous Owner | $222,400 | No Value Available | |
| Previous Owner | $27,100 | No Value Available | |
| Previous Owner | $190,000 | Purchase Money Mortgage | |
| Previous Owner | $47,500 | No Value Available |
Source: Public Records
Property History
| Date | Event | Price | Change | Sq Ft Price |
|---|---|---|---|---|
| 06/18/2025 06/18/25 | Pending | -- | -- | -- |
| 06/04/2025 06/04/25 | For Sale | $550,000 | 0.0% | $175 / Sq Ft |
| 05/26/2025 05/26/25 | Pending | -- | -- | -- |
| 04/23/2025 04/23/25 | For Sale | $550,000 | +83.3% | $175 / Sq Ft |
| 06/29/2020 06/29/20 | Sold | $300,000 | +1.7% | $96 / Sq Ft |
| 03/05/2020 03/05/20 | Pending | -- | -- | -- |
| 02/14/2020 02/14/20 | Price Changed | $294,900 | 0.0% | $94 / Sq Ft |
| 02/14/2020 02/14/20 | For Sale | $294,900 | +2.0% | $94 / Sq Ft |
| 11/26/2019 11/26/19 | Pending | -- | -- | -- |
| 11/22/2019 11/22/19 | For Sale | $289,000 | +31.2% | $92 / Sq Ft |
| 12/22/2017 12/22/17 | Sold | $220,230 | +10.2% | $70 / Sq Ft |
| 11/03/2017 11/03/17 | Pending | -- | -- | -- |
| 09/07/2017 09/07/17 | Price Changed | $199,900 | -4.4% | $64 / Sq Ft |
| 08/08/2017 08/08/17 | Price Changed | $209,000 | -4.5% | $67 / Sq Ft |
| 06/09/2017 06/09/17 | Price Changed | $218,900 | -2.7% | $70 / Sq Ft |
| 05/12/2017 05/12/17 | For Sale | $224,900 | +24.9% | $72 / Sq Ft |
| 03/25/2015 03/25/15 | Sold | $180,000 | -2.7% | $57 / Sq Ft |
| 03/02/2015 03/02/15 | For Sale | $184,995 | +27.6% | $59 / Sq Ft |
| 03/31/2014 03/31/14 | Sold | $145,000 | -23.3% | $46 / Sq Ft |
| 03/01/2014 03/01/14 | Pending | -- | -- | -- |
| 05/17/2013 05/17/13 | For Sale | $189,000 | -- | $60 / Sq Ft |
Source: MLS Property Information Network (MLS PIN)
Tax History Compared to Growth
Tax History
| Year | Tax Paid | Tax Assessment Tax Assessment Total Assessment is a certain percentage of the fair market value that is determined by local assessors to be the total taxable value of land and additions on the property. | Land | Improvement |
|---|---|---|---|---|
| 2025 | $4,304 | $375,900 | $104,800 | $271,100 |
| 2024 | $4,124 | $358,900 | $100,900 | $258,000 |
| 2023 | $3,583 | $292,000 | $83,400 | $208,600 |
| 2022 | $3,209 | $254,300 | $79,400 | $174,900 |
| 2021 | $3,065 | $221,600 | $75,600 | $146,000 |
| 2020 | $3,196 | $221,200 | $74,500 | $146,700 |
| 2019 | $2,445 | $192,400 | $71,700 | $120,700 |
| 2018 | $2,594 | $177,400 | $77,700 | $99,700 |
| 2017 | $2,650 | $189,300 | $74,700 | $114,600 |
| 2016 | $2,744 | $201,300 | $79,500 | $121,800 |
| 2015 | $2,663 | $203,600 | $79,500 | $124,100 |
| 2014 | $2,685 | $213,400 | $77,100 | $136,300 |
Source: Public Records
Agents Affiliated with this Home
-
Seller's Agent in 2025
Kyle Seyboth
(508) 726-3492
3 in this area
1,907 Total Sales
-
Seller's Agent in 2020
Cheryl Perry
Lamacchia Realty, Inc
(508) 965-0103
1 in this area
152 Total Sales
-
A
Buyer's Agent in 2020
Athena Tetrault
Lamacchia Realty, Inc
(508) 763-3121
34 Total Sales
-
Buyer's Agent in 2017
Mary Duperre
RE/MAX
5 Total Sales
-
Seller's Agent in 2015
Ken Johnson
Whitty Real Estate
(774) 259-8171
16 Total Sales
-
Seller's Agent in 2014
Karen McLinden
Beautiful Day Real Estate
(508) 642-6645
3 in this area
53 Total Sales
Map
Source: MLS Property Information Network (MLS PIN)
MLS Number: 72163661
APN: FALL-000007I-000000-000103
Disclaimer: Certain information contained herein is derived from information provided by parties other than Homes.com. All information provided is deemed reliable, but is not guaranteed to be accurate and should be independently verified.
![]() The property listing data and information, or the Images, set forth herein were provided to MLS Property Information Network, Inc. from third party sources, including sellers, lessors and public records, and were compiled by MLS Property Information Network, Inc. The property listing data and information, and the Images, are for the personal, non-commercial use of consumers having a good faith interest in purchasing or leasing listed properties of the type displayed to them and may not be used for any purpose other than to identify prospective properties which such consumers may have a good faith interest in purchasing or leasing. MLS Property Information Network, Inc. and its subscribers disclaim any and all representations and warranties as to the accuracy of the property listing data and information, or as to the accuracy of any of the Images, set forth herein.
The property listing data and information, or the Images, set forth herein were provided to MLS Property Information Network, Inc. from third party sources, including sellers, lessors and public records, and were compiled by MLS Property Information Network, Inc. The property listing data and information, and the Images, are for the personal, non-commercial use of consumers having a good faith interest in purchasing or leasing listed properties of the type displayed to them and may not be used for any purpose other than to identify prospective properties which such consumers may have a good faith interest in purchasing or leasing. MLS Property Information Network, Inc. and its subscribers disclaim any and all representations and warranties as to the accuracy of the property listing data and information, or as to the accuracy of any of the Images, set forth herein.
Nearby Homes