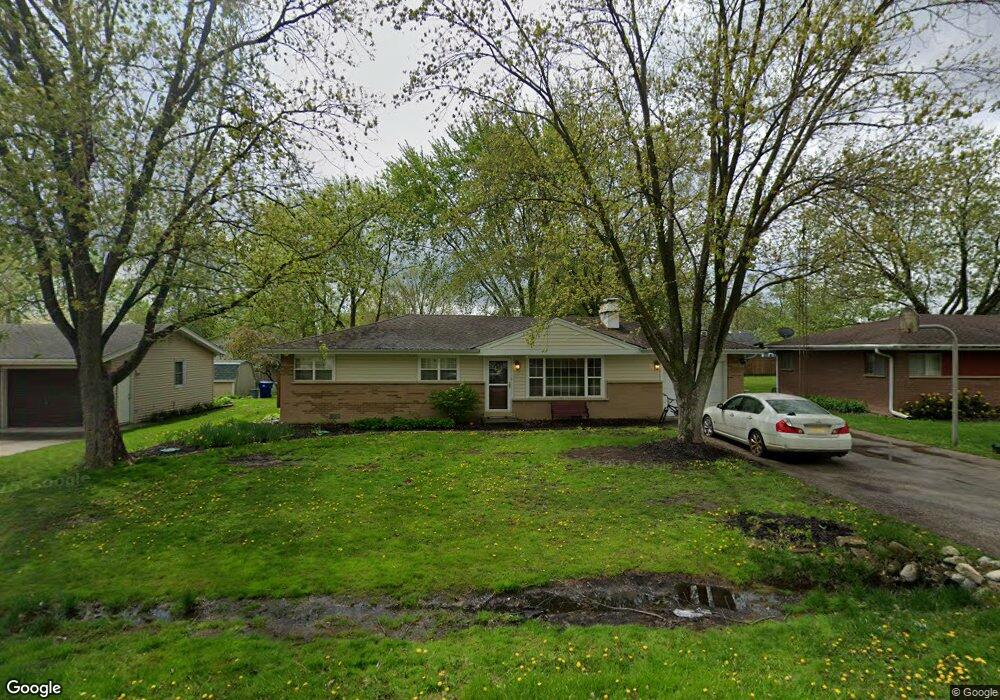
146 Michael Ln New Lenox, IL 60451
Estimated Value: $295,000 - $346,000
3
Beds
2
Baths
1,400
Sq Ft
$227/Sq Ft
Est. Value
About This Home
This home is located at 146 Michael Ln, New Lenox, IL 60451 and is currently estimated at $318,262, approximately $227 per square foot. 146 Michael Ln is a home located in Will County with nearby schools including Oster-Oakview School, Haines Elementary School, and Lincoln Way West.
Ownership History
Date
Name
Owned For
Owner Type
Purchase Details
Closed on
Jul 21, 2017
Sold by
Fiala Curt J
Bought by
Bond Randy A and Bond Jacqueline
Current Estimated Value
Home Financials for this Owner
Home Financials are based on the most recent Mortgage that was taken out on this home.
Original Mortgage
$186,240
Outstanding Balance
$155,031
Interest Rate
3.96%
Mortgage Type
New Conventional
Estimated Equity
$163,231
Purchase Details
Closed on
Jun 19, 2009
Sold by
Gonzalez Juan C and Gutierrez Laureen
Bought by
Fiala Curt J
Home Financials for this Owner
Home Financials are based on the most recent Mortgage that was taken out on this home.
Original Mortgage
$157,600
Interest Rate
4.92%
Mortgage Type
Purchase Money Mortgage
Purchase Details
Closed on
Mar 13, 2000
Sold by
Centracchio Anthony M and Centracchio Rhonda D
Bought by
Gonzalez Juan C and Gutierrez Laureen
Home Financials for this Owner
Home Financials are based on the most recent Mortgage that was taken out on this home.
Original Mortgage
$128,500
Interest Rate
8.39%
Create a Home Valuation Report for This Property
The Home Valuation Report is an in-depth analysis detailing your home's value as well as a comparison with similar homes in the area
Home Values in the Area
Average Home Value in this Area
Purchase History
| Date | Buyer | Sale Price | Title Company |
|---|---|---|---|
| Bond Randy A | $192,000 | Citywide Title Corporation | |
| Fiala Curt J | $197,000 | Ticor Title | |
| Gonzalez Juan C | $138,500 | -- |
Source: Public Records
Mortgage History
| Date | Status | Borrower | Loan Amount |
|---|---|---|---|
| Open | Bond Randy A | $186,240 | |
| Previous Owner | Fiala Curt J | $157,600 | |
| Previous Owner | Gonzalez Juan C | $128,500 |
Source: Public Records
Tax History Compared to Growth
Tax History
| Year | Tax Paid | Tax Assessment Tax Assessment Total Assessment is a certain percentage of the fair market value that is determined by local assessors to be the total taxable value of land and additions on the property. | Land | Improvement |
|---|---|---|---|---|
| 2024 | $6,025 | $85,002 | $20,237 | $64,765 |
| 2023 | $6,025 | $77,486 | $18,448 | $59,038 |
| 2022 | $5,454 | $71,383 | $16,995 | $54,388 |
| 2021 | $5,166 | $67,133 | $15,983 | $51,150 |
| 2020 | $5,011 | $64,738 | $15,413 | $49,325 |
| 2019 | $4,786 | $62,731 | $14,935 | $47,796 |
| 2018 | $4,667 | $60,568 | $14,420 | $46,148 |
| 2017 | $4,424 | $58,826 | $14,005 | $44,821 |
| 2016 | $4,288 | $57,251 | $13,630 | $43,621 |
| 2015 | $4,143 | $55,449 | $13,201 | $42,248 |
| 2014 | $4,143 | $54,764 | $13,038 | $41,726 |
| 2013 | $4,143 | $55,502 | $13,214 | $42,288 |
Source: Public Records
Map
Nearby Homes
- 1344 N Cedar Rd
- 133 Barbara Ln
- 200 Redwood Ave
- 208 Redwood Ave
- 1231 Town Crest Dr Unit E
- 1999 Silver Cross Blvd
- 217 Aspen Dr
- 12001 W Route 6
- 0 Silver Cross Blvd
- 1301 Silver Cross Blvd
- 807 Picardy Place
- 224 Hauser Ct
- 338 Willow St
- 125 Kimber Dr
- 1261 S Regan Rd
- 1920 Edmonds Ave
- 203 Fir St
- 331 Old Hickory Rd
- 13621 W Maple Rd
- 13741 Elizabeth Ln
- 142 Michael Ln
- 150 Michael Ln
- 139 Branchaw Blvd
- 154 Michael Ln
- 138 Michael Ln
- 135 Branchaw Blvd
- 143 Branchaw Blvd
- 145 Michael Ln
- 141 Michael Ln
- 149 Michael Ln
- 131 Branchaw Blvd
- 134 Michael Ln
- 158 Michael Ln
- 149 Branchaw Blvd
- 137 Michael Ln
- 153 Michael Ln
- 153 Michael Ln
- 133 Michael Ln
- 157 Michael Ln
- 130 Michael Ln