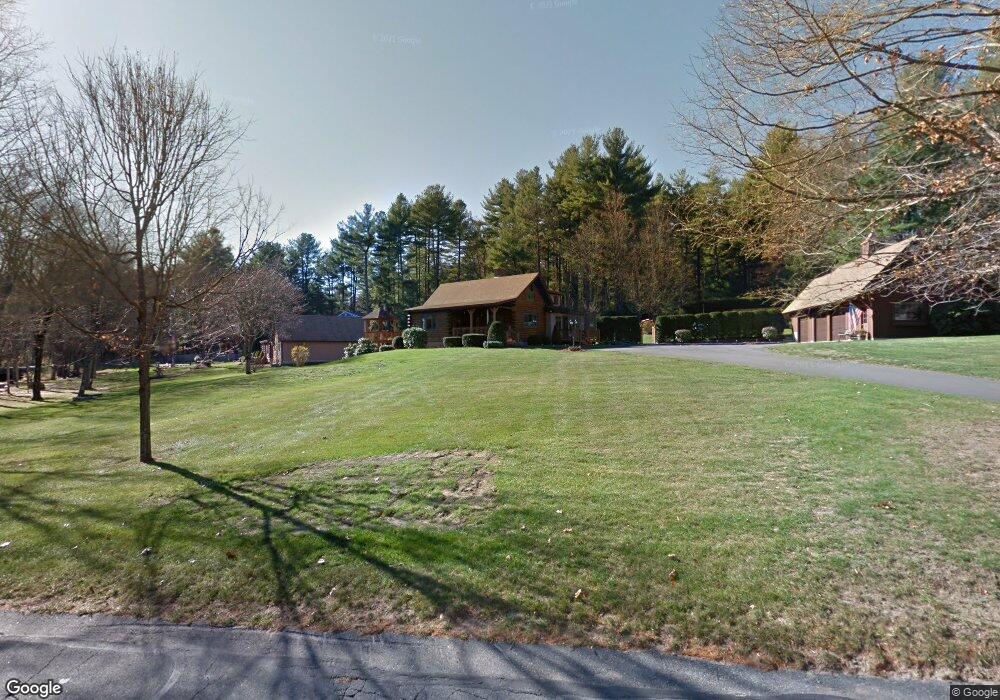
146 Strong St Easthampton, MA 01027
Estimated Value: $525,000 - $606,000
3
Beds
2
Baths
1,914
Sq Ft
$299/Sq Ft
Est. Value
About This Home
This home is located at 146 Strong St, Easthampton, MA 01027 and is currently estimated at $572,738, approximately $299 per square foot. 146 Strong St is a home located in Hampshire County with nearby schools including Easthampton High School, Calvary Baptist Christian School, and Tri-County Schools.
Ownership History
Date
Name
Owned For
Owner Type
Purchase Details
Closed on
Nov 13, 2024
Sold by
Malinowski John M and Malinowski Cynthia A
Bought by
Malinowski Irt and Malinowski
Current Estimated Value
Create a Home Valuation Report for This Property
The Home Valuation Report is an in-depth analysis detailing your home's value as well as a comparison with similar homes in the area
Home Values in the Area
Average Home Value in this Area
Purchase History
| Date | Buyer | Sale Price | Title Company |
|---|---|---|---|
| Malinowski Irt | -- | None Available | |
| Malinowski Irt | -- | None Available |
Source: Public Records
Tax History
| Year | Tax Paid | Tax Assessment Tax Assessment Total Assessment is a certain percentage of the fair market value that is determined by local assessors to be the total taxable value of land and additions on the property. | Land | Improvement |
|---|---|---|---|---|
| 2025 | $7,542 | $551,700 | $126,700 | $425,000 |
| 2024 | $7,386 | $544,700 | $123,000 | $421,700 |
| 2023 | $5,593 | $381,800 | $97,800 | $284,000 |
| 2022 | $6,311 | $381,800 | $97,800 | $284,000 |
| 2021 | $6,970 | $397,400 | $97,800 | $299,600 |
| 2020 | $6,781 | $381,800 | $97,800 | $284,000 |
| 2019 | $5,661 | $366,200 | $97,800 | $268,400 |
| 2018 | $5,480 | $342,500 | $92,300 | $250,200 |
| 2017 | $5,367 | $331,100 | $88,700 | $242,400 |
| 2016 | $5,202 | $333,700 | $88,700 | $245,000 |
| 2015 | $5,056 | $333,700 | $88,700 | $245,000 |
Source: Public Records
Map
Nearby Homes
Your Personal Tour Guide
Ask me questions while you tour the home.