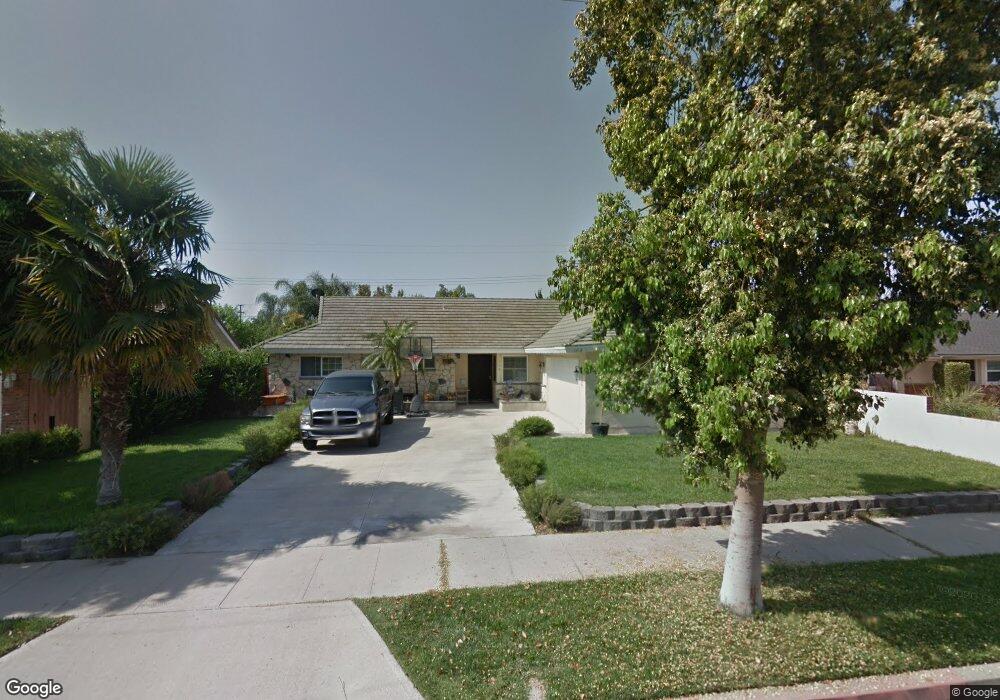
146 W Westway Ave Orange, CA 92865
Estimated Value: $1,024,094 - $1,058,000
4
Beds
2
Baths
1,505
Sq Ft
$691/Sq Ft
Est. Value
About This Home
This home is located at 146 W Westway Ave, Orange, CA 92865 and is currently estimated at $1,040,524, approximately $691 per square foot. 146 W Westway Ave is a home located in Orange County with nearby schools including Fletcher Mandarin Language & Gate Academy, Cerro Villa Middle School, and Villa Park High School.
Ownership History
Date
Name
Owned For
Owner Type
Purchase Details
Closed on
Jan 29, 2003
Sold by
Raum Charles and Alvord James C
Bought by
Hale Brent D and Hale Kristine L
Current Estimated Value
Home Financials for this Owner
Home Financials are based on the most recent Mortgage that was taken out on this home.
Original Mortgage
$292,000
Outstanding Balance
$123,961
Interest Rate
5.83%
Estimated Equity
$916,563
Purchase Details
Closed on
Mar 11, 1998
Sold by
Rodriguez Anita
Bought by
Cile Samuel A and Cile Josephine C
Purchase Details
Closed on
Apr 2, 1997
Sold by
Richard Rodriguez
Bought by
Rodriguez Anita
Purchase Details
Closed on
Apr 28, 1994
Sold by
East Janice Aileen
Bought by
Rodriguez Richard J and Rodriguez Anita
Home Financials for this Owner
Home Financials are based on the most recent Mortgage that was taken out on this home.
Original Mortgage
$180,500
Interest Rate
8.3%
Create a Home Valuation Report for This Property
The Home Valuation Report is an in-depth analysis detailing your home's value as well as a comparison with similar homes in the area
Home Values in the Area
Average Home Value in this Area
Purchase History
| Date | Buyer | Sale Price | Title Company |
|---|---|---|---|
| Hale Brent D | $360,000 | American Title Co | |
| Cile Samuel A | $188,000 | Fidelity National Title Ins | |
| Rodriguez Anita | -- | -- | |
| Rodriguez Richard J | $190,000 | World Title Company |
Source: Public Records
Mortgage History
| Date | Status | Borrower | Loan Amount |
|---|---|---|---|
| Open | Hale Brent D | $292,000 | |
| Previous Owner | Rodriguez Richard J | $180,500 |
Source: Public Records
Tax History Compared to Growth
Tax History
| Year | Tax Paid | Tax Assessment Tax Assessment Total Assessment is a certain percentage of the fair market value that is determined by local assessors to be the total taxable value of land and additions on the property. | Land | Improvement |
|---|---|---|---|---|
| 2025 | $5,798 | $528,632 | $432,120 | $96,512 |
| 2024 | $5,798 | $518,267 | $423,647 | $94,620 |
| 2023 | $5,668 | $508,105 | $415,340 | $92,765 |
| 2022 | $5,556 | $498,143 | $407,196 | $90,947 |
| 2021 | $5,401 | $488,376 | $399,212 | $89,164 |
| 2020 | $5,350 | $483,369 | $395,119 | $88,250 |
| 2019 | $5,282 | $473,892 | $387,372 | $86,520 |
| 2018 | $5,201 | $464,600 | $379,776 | $84,824 |
| 2017 | $4,985 | $455,491 | $372,330 | $83,161 |
| 2016 | $4,889 | $446,560 | $365,029 | $81,531 |
| 2015 | $4,816 | $439,853 | $359,546 | $80,307 |
| 2014 | $4,712 | $431,237 | $352,503 | $78,734 |
Source: Public Records
Map
Nearby Homes
- 224 W Crystal View Ave
- 2679 N Glenside St
- 2701 N Glenside St
- 2542 N Ashwood St
- 8641 N Orange Olive Rd
- 805 W Brentwood Ave
- 2890 N Glassell St
- 2671 N River Trail Rd
- 2117 N Orange Olive Rd
- 356 W Mountain Holly Ave
- 3052 N Spicewood St
- 116 W Cork Tree Dr
- 317 E Meadowbrook Ave
- 3029 N Cottonwood St Unit 12
- 3115 N Sunrise Ct
- 1201 E Saint James Ave
- 3002 N Pinewood St
- 349 E Meadowbrook Ave
- 238 S Trevor St
- 1231 E Boom Ave
- 134 W Westway Ave
- 204 W Westway Ave
- 143 W Greenway Ave
- 203 W Greenway Ave
- 133 W Greenway Ave
- 122 W Westway Ave
- 216 W Westway Ave
- 2534 N Fernside Cir
- 2534 N Fernside St
- 215 W Greenway Ave
- 232 W Westway Ave
- 2539 N Glenside Cir
- 112 W Westway Ave
- 226 W Westway Ave
- 2546 N Fernside Cir
- 225 W Greenway Ave
- 2531 N Fernside Cir
- 109 W Greenway Ave
- 144 W Greenway Ave
- 202 W Greenway Ave