Estimated Value: $159,093 - $202,000
2
Beds
1
Bath
876
Sq Ft
$205/Sq Ft
Est. Value
About This Home
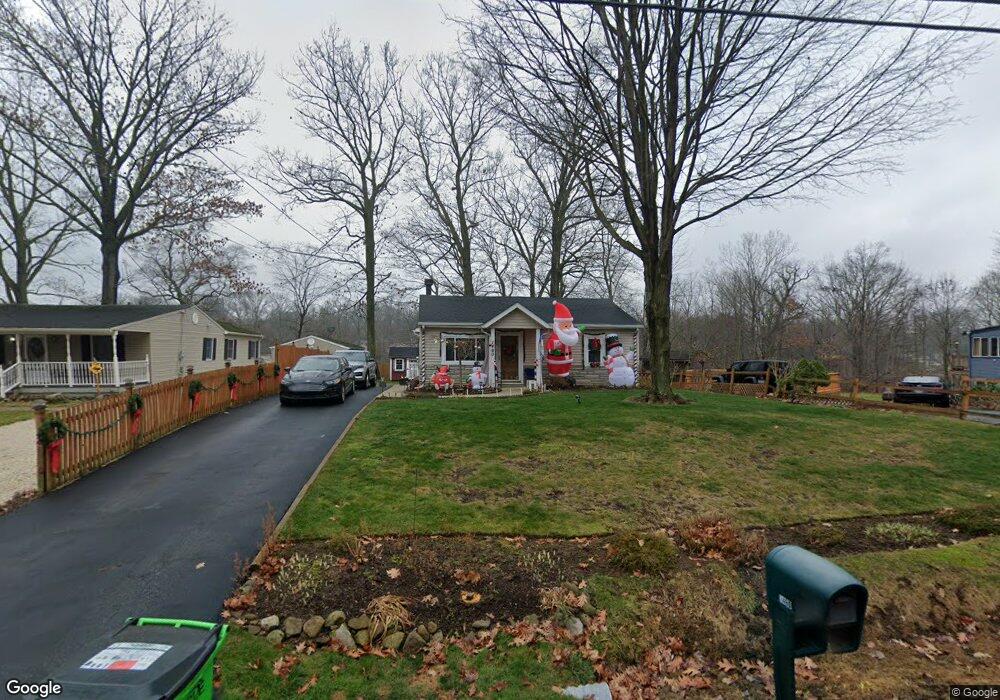
This home is located at 1460 Mac Dr, Stow, OH 44224 and is currently estimated at $179,523, approximately $204 per square foot. 1460 Mac Dr is a home located in Summit County with nearby schools including Stow-Munroe Falls High School, Primrose School of Hudson, and Holy Family Elementary School.
Ownership History
Date
Name
Owned For
Owner Type
Purchase Details
Closed on
Feb 6, 2006
Sold by
Bonner Keith D and Bonner Tina S
Bought by
Bonner Keith D and Bonner Tina S
Current Estimated Value
Home Financials for this Owner
Home Financials are based on the most recent Mortgage that was taken out on this home.
Original Mortgage
$21,000
Interest Rate
6.34%
Mortgage Type
New Conventional
Purchase Details
Closed on
Nov 21, 2002
Sold by
Frisbee Roy
Bought by
Bonner Keith D and Kidwell Tina S
Home Financials for this Owner
Home Financials are based on the most recent Mortgage that was taken out on this home.
Original Mortgage
$107,500
Outstanding Balance
$49,074
Interest Rate
7.25%
Estimated Equity
$130,449
Purchase Details
Closed on
Feb 27, 2002
Sold by
Ocwen Federal Bank Fsb
Bought by
Frisbee Roy
Purchase Details
Closed on
Jan 30, 2002
Sold by
Campbell Glen E
Bought by
Ocwen Federal Bank Fsb
Create a Home Valuation Report for This Property
The Home Valuation Report is an in-depth analysis detailing your home's value as well as a comparison with similar homes in the area
Home Values in the Area
Average Home Value in this Area
Purchase History
| Date | Buyer | Sale Price | Title Company |
|---|---|---|---|
| Bonner Keith D | -- | Northshore Title Agency | |
| Bonner Keith D | $107,500 | Wigley Title Agency Inc | |
| Frisbee Roy | $47,500 | -- | |
| Ocwen Federal Bank Fsb | $42,000 | Canton Title |
Source: Public Records
Mortgage History
| Date | Status | Borrower | Loan Amount |
|---|---|---|---|
| Closed | Bonner Keith D | $21,000 | |
| Open | Bonner Keith D | $107,500 |
Source: Public Records
Tax History
| Year | Tax Paid | Tax Assessment Tax Assessment Total Assessment is a certain percentage of the fair market value that is determined by local assessors to be the total taxable value of land and additions on the property. | Land | Improvement |
|---|---|---|---|---|
| 2024 | $2,555 | $44,773 | $10,630 | $34,143 |
| 2023 | $2,555 | $44,773 | $10,630 | $34,143 |
| 2022 | $2,161 | $33,310 | $7,872 | $25,438 |
| 2021 | $1,938 | $33,310 | $7,872 | $25,438 |
| 2020 | $1,905 | $33,310 | $7,870 | $25,440 |
| 2019 | $1,765 | $28,760 | $7,870 | $20,890 |
| 2018 | $1,736 | $28,760 | $7,870 | $20,890 |
| 2017 | $1,680 | $28,760 | $7,870 | $20,890 |
| 2016 | $1,728 | $27,020 | $7,870 | $19,150 |
| 2015 | $1,680 | $27,020 | $7,870 | $19,150 |
| 2014 | $1,682 | $27,020 | $7,870 | $19,150 |
| 2013 | $1,265 | $20,220 | $7,870 | $12,350 |
Source: Public Records
Map
Nearby Homes
- 0 Hibbard Dr
- 1525 Spruce Hill Dr
- 4623 Cox Dr
- 5123 Sodalite Dr
- 1921-1929 Ritchie Rd
- 5091 Ridge Meadow Dr
- 2279 Becket Cir
- 2352 Becket Cir
- V/L Housley Rd
- 1953 Arndale Rd
- V/L Norton Rd
- 5150 Bayside Lake Blvd
- 2221 Crockett Cir
- 4424 Timberdale Dr Unit 4428
- 5163 Beckett Ridge
- 1995 Weston Dr
- 2055-2059 Bryn Mawr Dr
- 2344 Echo Valley Dr
- 1969 Conwill Rd Unit 1973
- 3943 Darrow Rd
- 1464 Mac Dr
- 1470 Mac Dr
- 1450 Mac Dr
- 1480 Mac Dr Unit 1484
- 1442 Mac Dr
- 1453 Mac Dr
- 1436 Mac Dr Unit 1440
- 1439 Mac Dr
- 1493-1501 Mac Dr
- 1434 Mac Dr
- 1431 Mac Dr
- 1430 Mac Dr
- 1421 Mac Dr
- 1481 Meadowbrook Blvd
- 1424 Mac Dr
- 1420 Mac Dr Unit 1424
- 1487 Meadowbrook Blvd
- 1405 Mac Dr
- 1457 Meadowbrook Blvd
- 1459 Meadowbrook Blvd
Your Personal Tour Guide
Ask me questions while you tour the home.