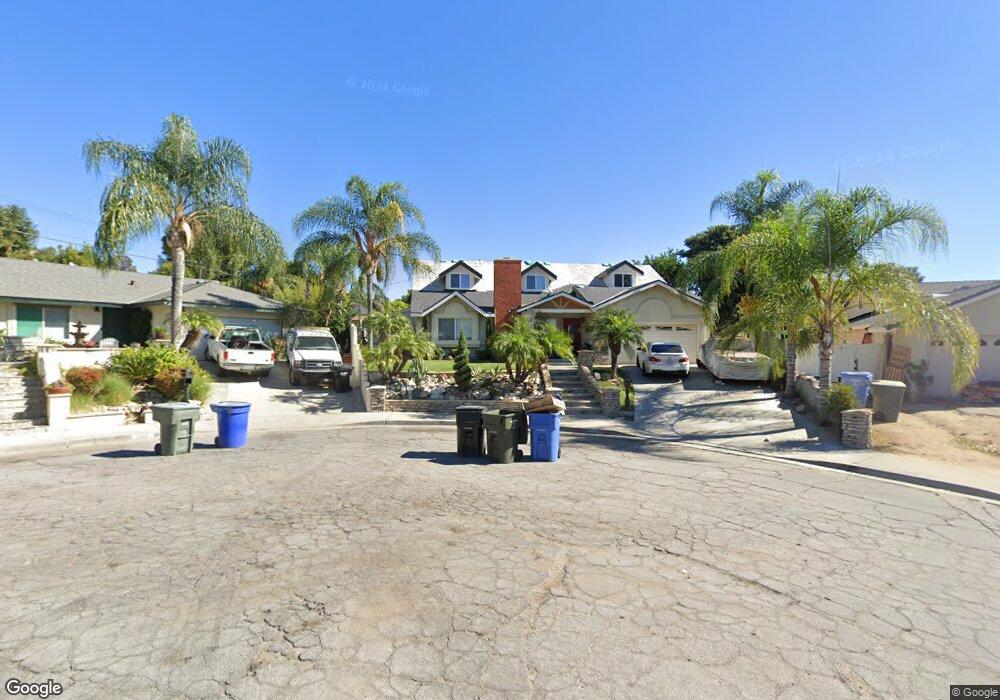
1460 Sao Paulo Place Pomona, CA 91768
Pomona Valley NeighborhoodEstimated Value: $714,856 - $788,000
4
Beds
2
Baths
1,380
Sq Ft
$550/Sq Ft
Est. Value
About This Home
This home is located at 1460 Sao Paulo Place, Pomona, CA 91768 and is currently estimated at $758,464, approximately $549 per square foot. 1460 Sao Paulo Place is a home located in Los Angeles County with nearby schools including Roosevelt Elementary School, Marshall Middle School, and Ganesha High School.
Ownership History
Date
Name
Owned For
Owner Type
Purchase Details
Closed on
Oct 11, 2001
Sold by
Cornejo Carlos
Bought by
Vargas Jose J and Vargas Susana
Current Estimated Value
Home Financials for this Owner
Home Financials are based on the most recent Mortgage that was taken out on this home.
Original Mortgage
$176,234
Outstanding Balance
$68,934
Interest Rate
6.88%
Mortgage Type
FHA
Estimated Equity
$689,530
Purchase Details
Closed on
Dec 12, 1997
Sold by
Bank Of America Nt & Sa
Bought by
Cornejo Carlos
Home Financials for this Owner
Home Financials are based on the most recent Mortgage that was taken out on this home.
Original Mortgage
$122,910
Interest Rate
7.22%
Mortgage Type
FHA
Purchase Details
Closed on
Jun 25, 1997
Sold by
Gaytan Rolando and Bank Of America Nt & Sa
Bought by
Bank Of America Nt & Sa
Purchase Details
Closed on
Mar 29, 1995
Sold by
Gaytan Rolando
Bought by
Gaytan Hortencia
Create a Home Valuation Report for This Property
The Home Valuation Report is an in-depth analysis detailing your home's value as well as a comparison with similar homes in the area
Home Values in the Area
Average Home Value in this Area
Purchase History
| Date | Buyer | Sale Price | Title Company |
|---|---|---|---|
| Vargas Jose J | $105,772 | Benefit Land Title | |
| Cornejo Carlos | $124,000 | -- | |
| Bank Of America Nt & Sa | $125,000 | -- | |
| Gaytan Hortencia | -- | -- |
Source: Public Records
Mortgage History
| Date | Status | Borrower | Loan Amount |
|---|---|---|---|
| Open | Vargas Jose J | $176,234 | |
| Previous Owner | Cornejo Carlos | $122,910 |
Source: Public Records
Tax History Compared to Growth
Tax History
| Year | Tax Paid | Tax Assessment Tax Assessment Total Assessment is a certain percentage of the fair market value that is determined by local assessors to be the total taxable value of land and additions on the property. | Land | Improvement |
|---|---|---|---|---|
| 2025 | $3,558 | $264,411 | $124,967 | $139,444 |
| 2024 | $3,558 | $259,227 | $122,517 | $136,710 |
| 2023 | $3,438 | $254,145 | $120,115 | $134,030 |
| 2022 | $3,383 | $249,162 | $117,760 | $131,402 |
| 2021 | $3,302 | $244,277 | $115,451 | $128,826 |
| 2019 | $3,370 | $237,034 | $112,028 | $125,006 |
| 2018 | $3,115 | $232,387 | $109,832 | $122,555 |
| 2016 | $2,922 | $223,365 | $105,568 | $117,797 |
| 2015 | $2,897 | $220,011 | $103,983 | $116,028 |
| 2014 | $2,882 | $215,703 | $101,947 | $113,756 |
Source: Public Records
Map
Nearby Homes
- 1384 Douglass Dr
- 1438 Val Vista St
- 1385 Val Vista St
- 1559 Stratus Dr
- 1263 Douglass Dr
- 1551 Stratus Dr
- 1549 Stratus Dr
- 1543 Stratus Dr
- 1565 Stratus Dr
- 1561 Stratus Dr
- 1583 Stratus Dr
- 1585 Stratus Dr
- 1579 Stratus Dr
- 1575 Stratus Dr
- 1573 Stratus Dr
- 1599 Stratus Dr
- 1597 Stratus Dr
- 1571 Stratus Dr
- 1593 Stratus Dr
- 1589 Stratus Dr
- 1438 Sao Paulo Place
- 1482 Sao Paulo Place
- 1443 Kenwood Dr
- 1457 Kenwood Dr
- 1416 Sao Paulo Place
- 1471 Sao Paulo Place
- 1379 Douglass Dr
- 1459 Sao Paulo Place
- 1416 Hillside Dr
- 1408 Hillside Dr
- 1437 Sao Paulo Place
- 1424 Hillside Dr
- 1378 Hillside Dr
- 1433 Douglass Dr
- 1432 Hillside Dr
- 1440 Hillside Dr
- 1353 Douglass Dr
- 1444 Kenwood Dr
- 1448 Hillside Dr
- 1458 Kenwood Dr