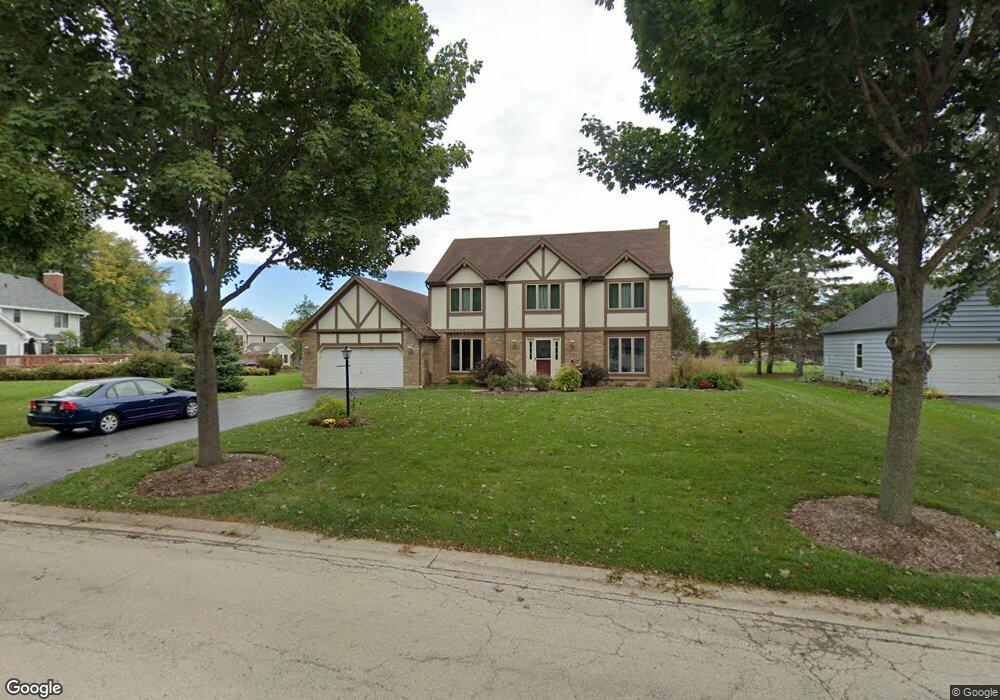
1460 Spring Hill Dr Algonquin, IL 60102
Estimated Value: $426,221 - $498,000
4
Beds
--
Bath
2,602
Sq Ft
$181/Sq Ft
Est. Value
About This Home
This home is located at 1460 Spring Hill Dr, Algonquin, IL 60102 and is currently estimated at $471,555, approximately $181 per square foot. 1460 Spring Hill Dr is a home located in Kane County with nearby schools including Westfield Community School, Kenneth E Neubert Elementary School, and Harry D Jacobs High School.
Ownership History
Date
Name
Owned For
Owner Type
Purchase Details
Closed on
Jun 25, 2021
Sold by
Atchison Thomas F and Atchison Catherine E
Bought by
Atchison Thomas F and Atchison Catherine E
Current Estimated Value
Purchase Details
Closed on
Nov 22, 2002
Sold by
Jackson John T
Bought by
Atchison Tom and Atchison Cathy
Home Financials for this Owner
Home Financials are based on the most recent Mortgage that was taken out on this home.
Original Mortgage
$200,000
Outstanding Balance
$85,187
Interest Rate
6.25%
Estimated Equity
$386,368
Purchase Details
Closed on
Dec 15, 1999
Sold by
Janis Gregory C and Janis Janet L
Bought by
Jackson John T
Home Financials for this Owner
Home Financials are based on the most recent Mortgage that was taken out on this home.
Original Mortgage
$216,750
Interest Rate
7.89%
Create a Home Valuation Report for This Property
The Home Valuation Report is an in-depth analysis detailing your home's value as well as a comparison with similar homes in the area
Purchase History
| Date | Buyer | Sale Price | Title Company |
|---|---|---|---|
| Atchison Thomas F | -- | Attorney | |
| Atchison Tom | $270,000 | Multiple | |
| Jackson John T | $255,000 | Ticor Title Insurance |
Source: Public Records
Mortgage History
| Date | Status | Borrower | Loan Amount |
|---|---|---|---|
| Open | Atchison Tom | $200,000 | |
| Previous Owner | Jackson John T | $216,750 |
Source: Public Records
Tax History
| Year | Tax Paid | Tax Assessment Tax Assessment Total Assessment is a certain percentage of the fair market value that is determined by local assessors to be the total taxable value of land and additions on the property. | Land | Improvement |
|---|---|---|---|---|
| 2024 | $8,616 | $129,326 | $25,228 | $104,098 |
| 2023 | $8,168 | $116,363 | $22,699 | $93,664 |
| 2022 | $8,590 | $108,783 | $22,699 | $86,084 |
| 2021 | $8,339 | $102,712 | $21,432 | $81,280 |
| 2020 | $8,178 | $100,403 | $20,950 | $79,453 |
| 2019 | $8,512 | $101,872 | $19,888 | $81,984 |
| 2018 | $8,465 | $97,814 | $26,182 | $71,632 |
| 2017 | $8,129 | $91,500 | $24,492 | $67,008 |
| 2016 | $8,339 | $88,594 | $23,714 | $64,880 |
| 2015 | -- | $83,016 | $22,221 | $60,795 |
| 2014 | -- | $75,238 | $21,607 | $53,631 |
| 2013 | -- | $77,541 | $22,268 | $55,273 |
Source: Public Records
Map
Nearby Homes
- SWC Talaga and Algonquin Rd
- 1850 White Oak Dr
- 1002 Interloch Ct Unit 152
- 1621 Glengarry Ct Unit 131
- 18 Peach Tree Ct Unit 4154
- 1530 Westbourne Pkwy
- 1540 Westbourne Pkwy
- 1900 Waverly Ln
- 1460 Lancaster Ln
- 2054 Peach Tree Ln Unit 4171
- 2051 Carlisle St
- 2069 Peach Tree Ln Unit 4116
- 2161 Burnham Ct
- 1030 Glenmont St
- 2224 Barrett Dr
- 301 Cold Spring St
- 1200 Hillside View
- 1000 Glenmont St
- 2010 Cosman Way
- 350 Cold Spring St
- 1450 Spring Hill Dr
- 1455 Gaslight Dr
- 1445 Gaslight Dr
- 1430 Brandywine Cir
- 1440 Spring Hill Dr
- 1435 Gaslight Dr
- 1420 Brandywine Cir
- 1495 Spring Hill Dr
- 1485 Spring Hill Dr
- 1425 Gaslight Dr
- 1430 Spring Hill Dr
- 1435 Brandywine Cir
- 1475 Spring Hill Dr
- 1499 Spring Hill Dr
- 1465 Spring Hill Dr
- 1415 Gaslight Dr
- 1480 Spring Hill Dr
- 1420 Spring Hill Dr
- 1410 Brandywine Cir
- 1440 Gaslight Dr
Your Personal Tour Guide
Ask me questions while you tour the home.