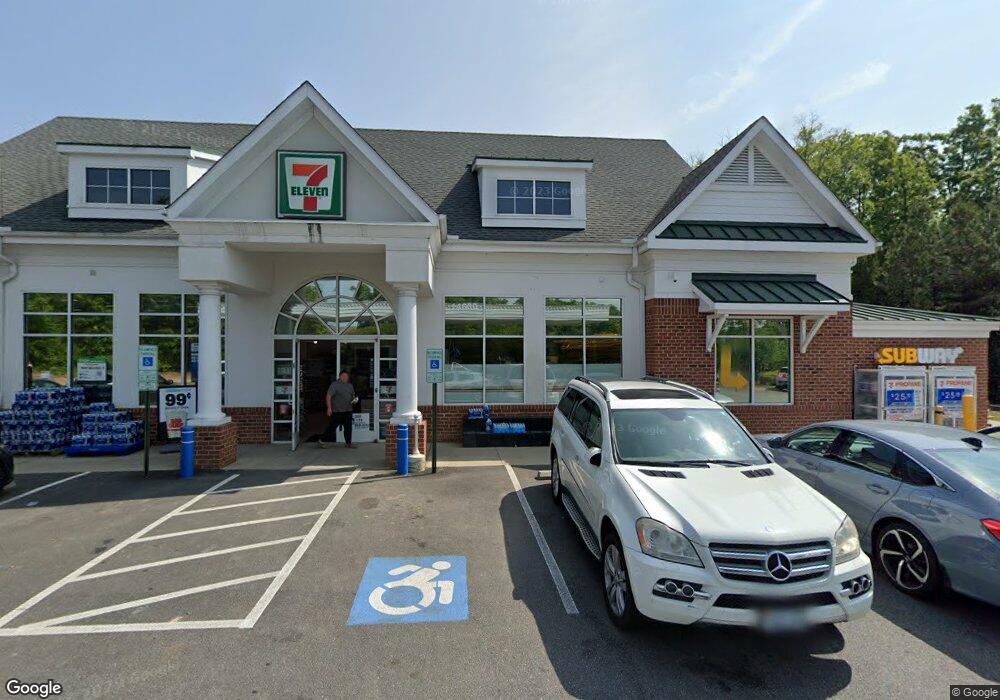
14600 Time Square Dr Midlothian, VA 23112
Estimated Value: $5,838,692
Studio
--
Bath
873
Sq Ft
$6,688/Sq Ft
Est. Value
About This Home
This home is located at 14600 Time Square Dr, Midlothian, VA 23112 and is currently estimated at $5,838,692, approximately $6,688 per square foot. 14600 Time Square Dr is a home located in Chesterfield County with nearby schools including Old Hundred Elementary School, Tomahawk Creek Middle School, and Midlothian High School.
Ownership History
Date
Name
Owned For
Owner Type
Purchase Details
Closed on
Mar 26, 2018
Sold by
7-Eleven Inc A Texas Corporation
Bought by
Mdc Coast 6 Llc A Delaware Limited Liabi
Current Estimated Value
Purchase Details
Closed on
Jan 23, 2018
Sold by
Macs Retail Llc A Virginia Limited Liabi
Bought by
7-Eleven Inc A Texas Corporation
Purchase Details
Closed on
Dec 22, 2015
Sold by
Land 8351 Llc A Virginia Limited Liabili
Bought by
Macs Retail Llc A Virginia Limited Liabi
Purchase Details
Closed on
Jul 23, 2009
Sold by
Chesterfield Co Of Va
Bought by
Land 8351 L L C
Purchase Details
Closed on
Jun 6, 2007
Sold by
Reservoir Land Associates
Bought by
Land 8351 Llc
Home Financials for this Owner
Home Financials are based on the most recent Mortgage that was taken out on this home.
Original Mortgage
$650,000
Interest Rate
6.17%
Mortgage Type
Commercial
Create a Home Valuation Report for This Property
The Home Valuation Report is an in-depth analysis detailing your home's value as well as a comparison with similar homes in the area
Home Values in the Area
Average Home Value in this Area
Purchase History
| Date | Buyer | Sale Price | Title Company |
|---|---|---|---|
| Mdc Coast 6 Llc A Delaware Limited Liabi | $3,529,222 | Stewart Title Guaranty Co | |
| 7-Eleven Inc A Texas Corporation | $2,492,000 | Stewart Title Guaranty Co | |
| Macs Retail Llc A Virginia Limited Liabi | $3,258,340 | Attorney | |
| Land 8351 L L C | -- | -- | |
| Land 8351 Llc | $585,000 | -- |
Source: Public Records
Mortgage History
| Date | Status | Borrower | Loan Amount |
|---|---|---|---|
| Previous Owner | Land 8351 Llc | $650,000 |
Source: Public Records
Tax History
| Year | Tax Paid | Tax Assessment Tax Assessment Total Assessment is a certain percentage of the fair market value that is determined by local assessors to be the total taxable value of land and additions on the property. | Land | Improvement |
|---|---|---|---|---|
| 2025 | $13,005 | $2,495,700 | $564,700 | $1,931,000 |
| 2024 | $13,005 | $2,421,300 | $564,700 | $1,856,600 |
| 2023 | $21,871 | $2,403,400 | $564,700 | $1,838,700 |
| 2022 | $19,674 | $2,138,500 | $564,700 | $1,573,800 |
| 2021 | $9,100 | $1,879,000 | $564,700 | $1,314,300 |
| 2020 | $17,851 | $1,879,000 | $564,700 | $1,314,300 |
| 2019 | $9,289 | $1,839,800 | $539,100 | $1,300,700 |
| 2018 | $17,283 | $1,819,300 | $539,100 | $1,280,200 |
| 2017 | $16,891 | $1,759,500 | $539,100 | $1,220,400 |
| 2016 | $16,891 | $1,759,500 | $539,100 | $1,220,400 |
| 2015 | $8,292 | $1,727,400 | $539,100 | $1,188,300 |
| 2014 | $16,583 | $1,727,400 | $539,100 | $1,188,300 |
Source: Public Records
Map
Nearby Homes
- 14936 Endstone Trail
- Riverton Plan at RounTrey - Rountrey
- Shearwater Plan at RounTrey
- Whimbrel Plan at RounTrey
- Olivia Plan at RounTrey - Rountrey
- Chatham Plan at RounTrey
- Sienna Plan at RounTrey - Rountrey
- Tiffany I Plan at RounTrey - Rountrey
- Bronte Plan at RounTrey - Rountrey
- Hampshire Plan at RounTrey - Rountrey
- Astoria Plan at RounTrey
- Southport Plan at RounTrey
- Elliot Plan at RounTrey - Rountrey
- Sutherland Plan at RounTrey - Rountrey
- Coronado Plan at RounTrey
- Kingfisher Plan at RounTrey
- 3701 Graythorne Dr
- 14624 Spaldwick Ln
- 15060 Dordon Ln
- 14825 Abberton Dr
- 15006 Mariners Way
- 2737 Bayfront Way
- 14500 Time Square Dr
- 2743 Bayfront Way
- 2731 Bayfront Way
- 2510 Sailboat Dr
- 2900 Mariners Place
- 2906 Mariners Place
- 2801 Bayfront Way
- 2725 Bayfront Way
- 2807 Bayfront Way
- 14295 Bayfront Place
- 2907 Mariners Place
- 14512 Sailboat Cir
- 2912 Mariners Place
- 14900 Bayfront Place
- 14508 Sailboat Cir
- 14800 Mariners Way
- 14516 Sailboat Cir
- 14842 Windjammer Dr
Your Personal Tour Guide
Ask me questions while you tour the home.