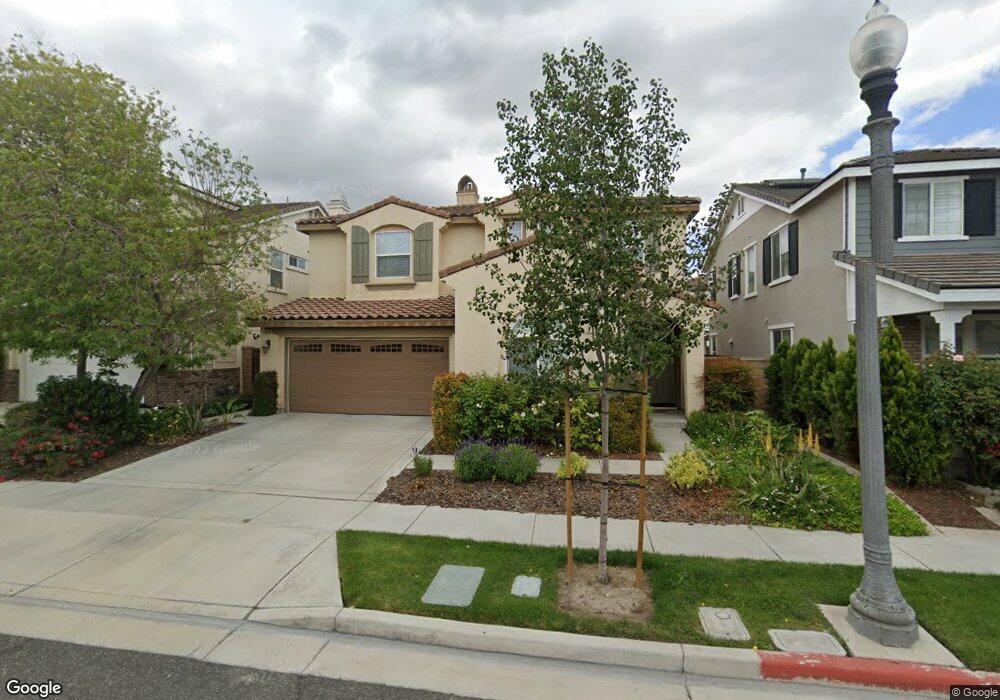
14601 Excelsior Ave Chino, CA 91710
College Park NeighborhoodEstimated Value: $869,882 - $916,000
4
Beds
3
Baths
2,687
Sq Ft
$333/Sq Ft
Est. Value
About This Home
This home is located at 14601 Excelsior Ave, Chino, CA 91710 and is currently estimated at $893,721, approximately $332 per square foot. 14601 Excelsior Ave is a home located in San Bernardino County with nearby schools including Edwin Rhodes Elementary, Magnolia Junior High, and Chino High School.
Ownership History
Date
Name
Owned For
Owner Type
Purchase Details
Closed on
Oct 27, 2014
Sold by
Lee Bernice
Bought by
Liu Ben and Lee Bernice
Current Estimated Value
Home Financials for this Owner
Home Financials are based on the most recent Mortgage that was taken out on this home.
Original Mortgage
$231,000
Outstanding Balance
$171,031
Interest Rate
3.12%
Mortgage Type
Adjustable Rate Mortgage/ARM
Estimated Equity
$722,690
Purchase Details
Closed on
Dec 22, 2009
Sold by
Liu Ben
Bought by
Lee Bernice
Purchase Details
Closed on
Oct 21, 2009
Sold by
Stg College Park Llc
Bought by
Lee Bernice
Home Financials for this Owner
Home Financials are based on the most recent Mortgage that was taken out on this home.
Original Mortgage
$250,250
Interest Rate
4.88%
Mortgage Type
New Conventional
Purchase Details
Closed on
Aug 13, 2008
Sold by
California Bank & Trust
Bought by
Stg College Park Llc
Purchase Details
Closed on
Aug 4, 2008
Sold by
Pinnacle College Park Pa 4 Llc
Bought by
California Bank & Trust
Create a Home Valuation Report for This Property
The Home Valuation Report is an in-depth analysis detailing your home's value as well as a comparison with similar homes in the area
Home Values in the Area
Average Home Value in this Area
Purchase History
| Date | Buyer | Sale Price | Title Company |
|---|---|---|---|
| Liu Ben | -- | Spl Title Services | |
| Lee Bernice | -- | First American Title Company | |
| Lee Bernice | $385,000 | First American Title Company | |
| Stg College Park Llc | -- | First American Title Company | |
| California Bank & Trust | $4,720,000 | Accommodation |
Source: Public Records
Mortgage History
| Date | Status | Borrower | Loan Amount |
|---|---|---|---|
| Open | Liu Ben | $231,000 | |
| Previous Owner | Lee Bernice | $250,250 |
Source: Public Records
Tax History Compared to Growth
Tax History
| Year | Tax Paid | Tax Assessment Tax Assessment Total Assessment is a certain percentage of the fair market value that is determined by local assessors to be the total taxable value of land and additions on the property. | Land | Improvement |
|---|---|---|---|---|
| 2025 | $10,393 | $496,966 | $154,898 | $342,068 |
| 2024 | $10,393 | $487,222 | $151,861 | $335,361 |
| 2023 | $10,244 | $477,668 | $148,883 | $328,785 |
| 2022 | $10,212 | $468,302 | $145,964 | $322,338 |
| 2021 | $10,110 | $459,120 | $143,102 | $316,018 |
| 2020 | $10,044 | $454,413 | $141,635 | $312,778 |
| 2019 | $9,956 | $445,503 | $138,858 | $306,645 |
| 2018 | $9,847 | $436,767 | $136,135 | $300,632 |
| 2017 | $9,760 | $428,203 | $133,466 | $294,737 |
| 2016 | $9,452 | $419,807 | $130,849 | $288,958 |
| 2015 | $9,436 | $413,502 | $128,884 | $284,618 |
| 2014 | $9,276 | $405,402 | $126,359 | $279,043 |
Source: Public Records
Map
Nearby Homes
- 6781 Vanderbilt St
- 6842 Morehouse St
- 14575 San Antonio Ave
- 14585 Baylor Ave
- 6656 Biola St
- 6958 Clemson St
- 6685 Eucalyptus Ave
- 14560 Purdue Ave
- 6829 Birmingham Dr
- 6641 Eucalyptus Ave
- 6599 Eucalyptus Ave
- 14551 Longwood Ave Unit 99
- 14571 Longwood Ave
- 6568 Youngstown St
- 6956 Dublin Dr
- 6550 Eucalyptus Ave
- 6501 Wheaton St
- 14400 Belhaven Ave
- 14380 Belhaven Ave
- 14132 Peral Ct
- 14607 Excelsior Ave
- 14595 Excelsior Ave
- 14598 Tuskegee Ave
- 14602 Tuskegee Ave
- 14592 Tuskegee Ave
- 14611 Excelsior Ave
- 14591 Excelsior Ave
- 14610 Tuskegee Ave
- 14588 Tuskegee Ave
- 14602 Excelsior Ave
- 14598 Excelsior Ave
- 14608 Excelsior Ave
- 14585 Excelsior Ave
- 14617 Excelsior Ave
- 14612 Excelsior Ave
- 14590 Excelsior Ave
- 14582 Tuskegee Ave
- 14616 Tuskegee Ave
- 14586 Excelsior Ave
- 14618 Excelsior Ave