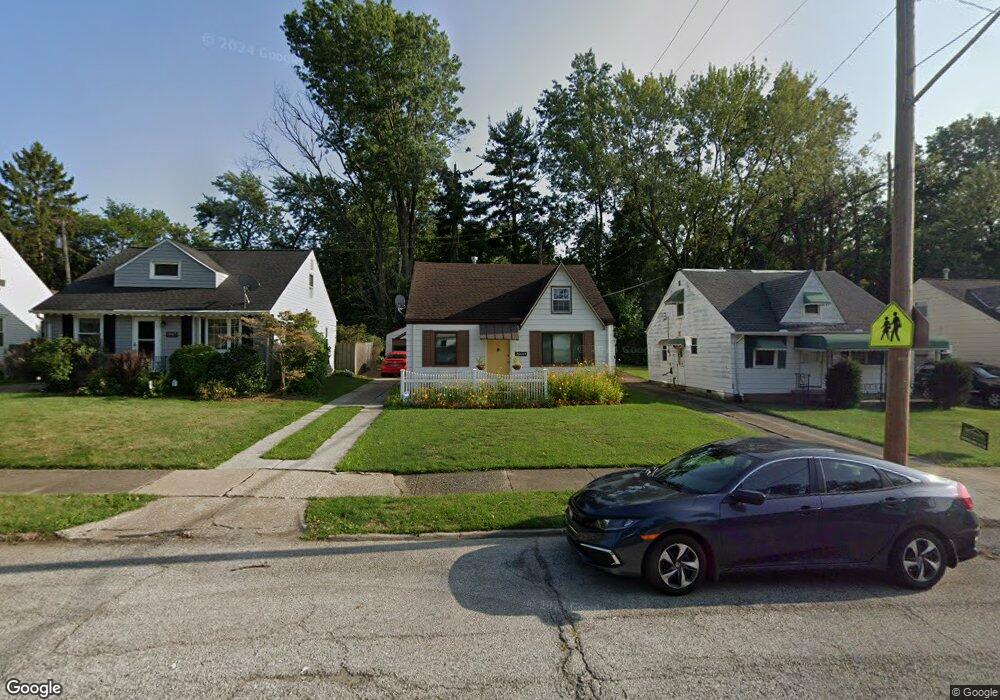
14605 Grapeland Ave Cleveland, OH 44111
Kamm's Corners NeighborhoodEstimated Value: $152,000 - $233,000
3
Beds
1
Bath
975
Sq Ft
$187/Sq Ft
Est. Value
About This Home
This home is located at 14605 Grapeland Ave, Cleveland, OH 44111 and is currently estimated at $182,448, approximately $187 per square foot. 14605 Grapeland Ave is a home located in Cuyahoga County with nearby schools including Artemus Ward School, Almira Academy, and Anton Grdina School.
Ownership History
Date
Name
Owned For
Owner Type
Purchase Details
Closed on
Oct 24, 2005
Sold by
Manning Colleen M and Manning Anthony L
Bought by
Withem Terri A
Current Estimated Value
Home Financials for this Owner
Home Financials are based on the most recent Mortgage that was taken out on this home.
Original Mortgage
$27,900
Interest Rate
5.56%
Mortgage Type
Stand Alone Second
Purchase Details
Closed on
Nov 29, 1994
Sold by
Emerald Equities Ptns
Bought by
Manning Colleen M
Purchase Details
Closed on
Oct 16, 1992
Sold by
Bostwick Joseph P
Bought by
Emerald Equities Part An
Purchase Details
Closed on
Nov 16, 1981
Sold by
Livingston William J
Bought by
Bostwick Joseph P
Purchase Details
Closed on
Jun 30, 1980
Sold by
Blessinger Robert D
Bought by
Livingston William J
Purchase Details
Closed on
Sep 13, 1978
Sold by
Vannoy Wilma M
Bought by
Blessinger Robert D
Purchase Details
Closed on
Jan 1, 1975
Bought by
Vannoy Wilma M
Create a Home Valuation Report for This Property
The Home Valuation Report is an in-depth analysis detailing your home's value as well as a comparison with similar homes in the area
Home Values in the Area
Average Home Value in this Area
Purchase History
| Date | Buyer | Sale Price | Title Company |
|---|---|---|---|
| Withem Terri A | $92,900 | Truetitle Agency | |
| Manning Colleen M | $70,000 | -- | |
| Emerald Equities Part An | $49,100 | -- | |
| Bostwick Joseph P | $49,500 | -- | |
| Livingston William J | $47,300 | -- | |
| Blessinger Robert D | $41,700 | -- | |
| Vannoy Wilma M | -- | -- |
Source: Public Records
Mortgage History
| Date | Status | Borrower | Loan Amount |
|---|---|---|---|
| Closed | Withem Terri A | $27,900 | |
| Open | Withem Terri A | $65,000 |
Source: Public Records
Tax History Compared to Growth
Tax History
| Year | Tax Paid | Tax Assessment Tax Assessment Total Assessment is a certain percentage of the fair market value that is determined by local assessors to be the total taxable value of land and additions on the property. | Land | Improvement |
|---|---|---|---|---|
| 2024 | $3,098 | $47,250 | $10,885 | $36,365 |
| 2023 | $2,727 | $35,950 | $8,790 | $27,160 |
| 2022 | $2,711 | $35,950 | $8,790 | $27,160 |
| 2021 | $2,684 | $35,950 | $8,790 | $27,160 |
| 2020 | $2,389 | $27,650 | $6,760 | $20,900 |
| 2019 | $2,209 | $79,000 | $19,300 | $59,700 |
| 2018 | $2,213 | $27,650 | $6,760 | $20,900 |
| 2017 | $2,243 | $27,200 | $5,920 | $21,280 |
| 2016 | $2,226 | $27,200 | $5,920 | $21,280 |
| 2015 | $2,029 | $27,200 | $5,920 | $21,280 |
| 2014 | $2,029 | $24,710 | $5,390 | $19,320 |
Source: Public Records
Map
Nearby Homes
- 14625 Grapeland Ave
- 14608 Triskett Rd
- 14315 Rainbow Ave
- 3475 W 145th St
- 14328 Adrian Ave
- 14303 Tuckahoe Ave
- 32743 Warren Rd Unit 19
- 32742 Warren Rd Unit 18
- 3445 W 152nd St
- 14426 Alger Rd
- 3334 W 155th St
- 3549 Warren Rd
- 3615 W 147th St
- 15537 Munn Rd
- 14104 Hazelmere Ave
- 3739 Warren Rd
- 14114 Berwyn Ave
- 13931 Lorain Ave
- 3201 W 139th St
- 3395 W 136th St
- 14601 Grapeland Ave
- 14541 Grapeland Ave
- 14613 Grapeland Ave
- 14617 Grapeland Ave
- 14537 Grapeland Ave
- 14604 Grapeland Ave
- 14600 Grapeland Ave
- 14610 Grapeland Ave
- 14621 Grapeland Ave
- 14614 Grapeland Ave
- 14600 Triskett Rd
- 14529 Grapeland Ave
- 14618 Grapeland Ave
- 14604 Triskett Rd
- 14525 Grapeland Ave
- 14622 Grapeland Ave
- 14629 Grapeland Ave
- 14605 Harley Ave
- 14611 Harley Ave
- 14601 Harley Ave