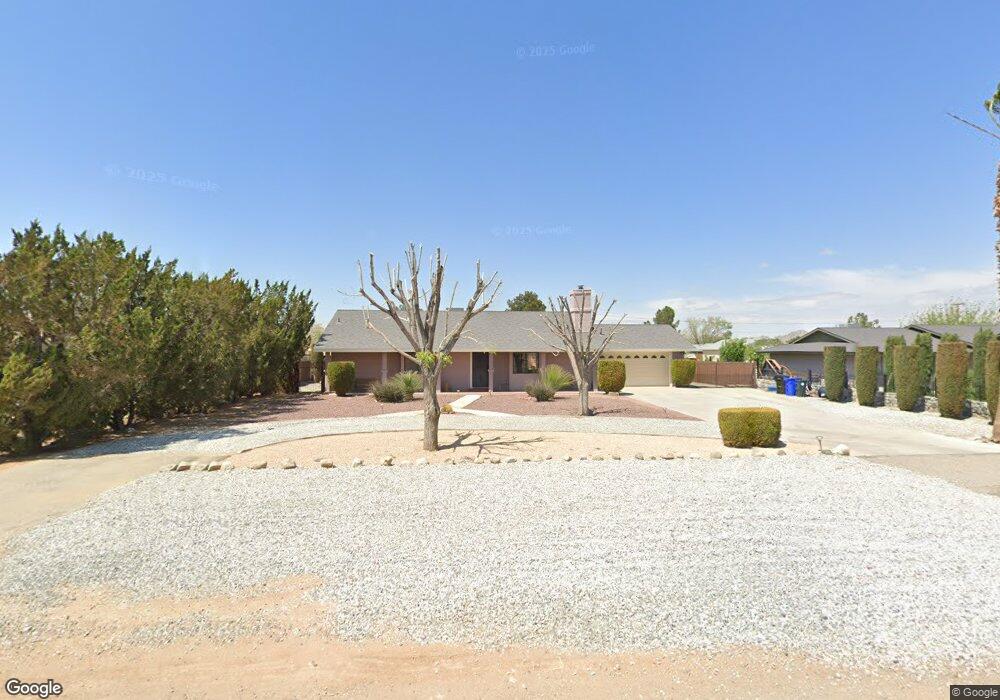
14606 Central Rd Apple Valley, CA 92307
High Desert NeighborhoodEstimated Value: $352,000 - $408,000
3
Beds
2
Baths
1,445
Sq Ft
$266/Sq Ft
Est. Value
About This Home
This home is located at 14606 Central Rd, Apple Valley, CA 92307 and is currently estimated at $384,421, approximately $266 per square foot. 14606 Central Rd is a home located in San Bernardino County with nearby schools including Rancho Verde Elementary School and Granite Hills High School.
Ownership History
Date
Name
Owned For
Owner Type
Purchase Details
Closed on
Feb 25, 2020
Sold by
Lane James R and Lane Betty D
Bought by
Lane James R and Lane Betty D
Current Estimated Value
Home Financials for this Owner
Home Financials are based on the most recent Mortgage that was taken out on this home.
Original Mortgage
$222,000
Outstanding Balance
$196,613
Interest Rate
3.5%
Mortgage Type
New Conventional
Estimated Equity
$187,808
Purchase Details
Closed on
Apr 26, 2019
Sold by
Duron Theresa and Duron Marcos
Bought by
Duran Lane Jr James R and Duran Lane Betty
Home Financials for this Owner
Home Financials are based on the most recent Mortgage that was taken out on this home.
Original Mortgage
$201,286
Interest Rate
4.75%
Mortgage Type
FHA
Purchase Details
Closed on
Sep 24, 2007
Sold by
Duron Marcos and Duron Theresa
Bought by
Duron Marcos and Duron Marcos Theresa
Create a Home Valuation Report for This Property
The Home Valuation Report is an in-depth analysis detailing your home's value as well as a comparison with similar homes in the area
Home Values in the Area
Average Home Value in this Area
Purchase History
| Date | Buyer | Sale Price | Title Company |
|---|---|---|---|
| Lane James R | -- | Ticor Title Company Of Ca | |
| Duran Lane Jr James R | $205,000 | Chicago Title Company | |
| Duron Marcos | -- | None Available | |
| Duron Marcos | -- | None Available |
Source: Public Records
Mortgage History
| Date | Status | Borrower | Loan Amount |
|---|---|---|---|
| Open | Lane James R | $222,000 | |
| Closed | Duran Lane Jr James R | $201,286 |
Source: Public Records
Tax History
| Year | Tax Paid | Tax Assessment Tax Assessment Total Assessment is a certain percentage of the fair market value that is determined by local assessors to be the total taxable value of land and additions on the property. | Land | Improvement |
|---|---|---|---|---|
| 2025 | $2,646 | $228,681 | $45,736 | $182,945 |
| 2024 | $2,570 | $224,197 | $44,839 | $179,358 |
| 2023 | $2,545 | $219,801 | $43,960 | $175,841 |
| 2022 | $2,505 | $215,491 | $43,098 | $172,393 |
| 2021 | $2,446 | $211,266 | $42,253 | $169,013 |
| 2020 | $2,489 | $209,100 | $41,820 | $167,280 |
| 2019 | $1,472 | $126,136 | $17,502 | $108,634 |
| 2018 | $1,435 | $123,663 | $17,159 | $106,504 |
| 2017 | $1,413 | $121,239 | $16,823 | $104,416 |
| 2016 | $1,330 | $118,862 | $16,493 | $102,369 |
| 2015 | $1,309 | $117,076 | $16,245 | $100,831 |
| 2014 | $1,290 | $114,783 | $15,927 | $98,856 |
Source: Public Records
Map
Nearby Homes
- 13630 Central Rd
- 0 Isatis Ave Unit HD25088205
- 14499 Mirada Place
- 14783 Tonikan Ln
- 0 Pioneer Rd Unit HD26026684
- 0 Pioneer Rd Unit RS25234657
- 0 Pioneer Rd Unit HD26031732
- 0 Pioneer Rd Unit HD25263022
- 0 Pioneer Rd Unit PW23193404
- 22184 Hupa Rd
- 14892 White Sage Rd
- 14878 Desert Lily Ct
- 14818 Desert Lily Ct
- 14857 Desert Lily Ct
- 14873 Desert Lily Ct
- 14829 Desert Lily Ct
- 14891 Desert Lily Ct
- 14792 Desert Lily Ct
- 14769 Nanticoke Rd
- 14455 Quinnault Rd
- 14622 Central Rd
- 14590 Central Rd
- 14638 Central Rd
- 14576 Central Rd
- 14605 Temecula Rd
- 14621 Temecula Rd
- 14589 Temecula Rd
- 14637 Temecula Rd
- 14575 Temecula Rd
- 22481 Klickitat Ave
- 14653 Temecula Rd
- 14544 Central Rd
- 30800410 Central Rd
- 4370525 20000 Central Rd
- 10 acres Central Rd
- 19640 Central Rd
- 109 Central Rd
- 370000 Central Rd
- 360000 Central Rd
- 14545 Temecula Rd
Your Personal Tour Guide
Ask me questions while you tour the home.