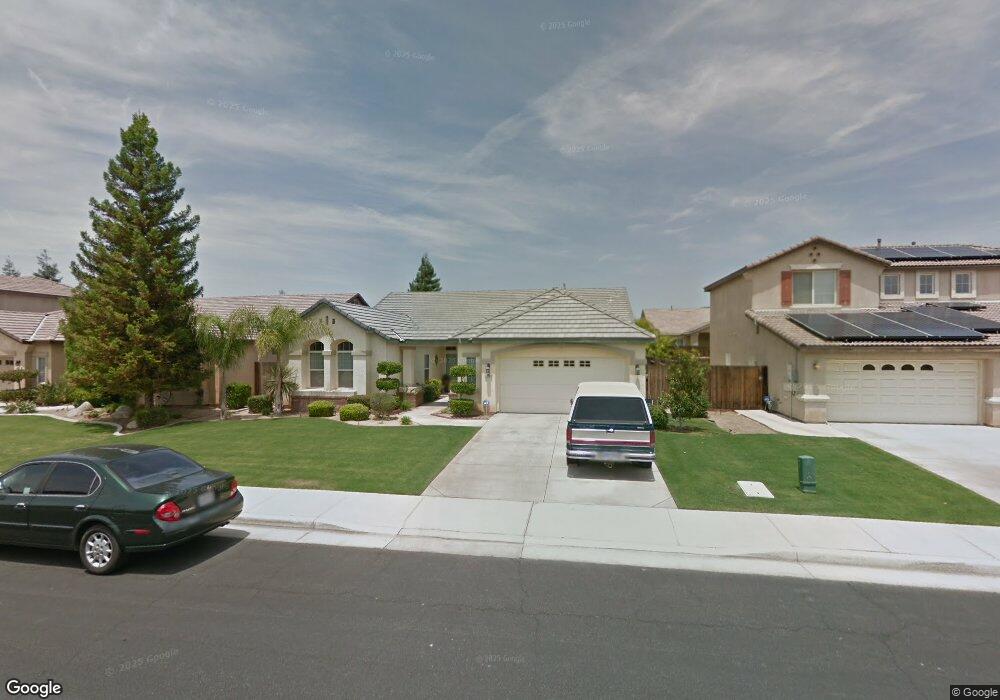
14608 Tralee Dr Bakersfield, CA 93314
Estimated Value: $469,000 - $486,066
3
Beds
2
Baths
2,541
Sq Ft
$189/Sq Ft
Est. Value
About This Home
This home is located at 14608 Tralee Dr, Bakersfield, CA 93314 and is currently estimated at $479,517, approximately $188 per square foot. 14608 Tralee Dr is a home located in Kern County with nearby schools including Del Rio Elementary School, Rosedale Middle School, and Liberty High School.
Ownership History
Date
Name
Owned For
Owner Type
Purchase Details
Closed on
Oct 4, 2024
Sold by
Magana Ruben and Magana Hermelinda
Bought by
Magana Family Trust and Magana
Current Estimated Value
Purchase Details
Closed on
Jan 11, 2010
Sold by
Wachovia Mortgage Fsb
Bought by
Magana Ruben and Magana Hermelinda
Home Financials for this Owner
Home Financials are based on the most recent Mortgage that was taken out on this home.
Original Mortgage
$211,105
Interest Rate
4.87%
Mortgage Type
FHA
Purchase Details
Closed on
Oct 9, 2009
Sold by
Montellano Ofelia
Bought by
Wachovia Mortgage Fsb and World Savings Bank Fsb
Purchase Details
Closed on
Aug 4, 2005
Sold by
Lennar Homes Of California Inc
Bought by
Montellano Ofelia
Home Financials for this Owner
Home Financials are based on the most recent Mortgage that was taken out on this home.
Original Mortgage
$311,329
Interest Rate
6.75%
Mortgage Type
Fannie Mae Freddie Mac
Create a Home Valuation Report for This Property
The Home Valuation Report is an in-depth analysis detailing your home's value as well as a comparison with similar homes in the area
Home Values in the Area
Average Home Value in this Area
Purchase History
| Date | Buyer | Sale Price | Title Company |
|---|---|---|---|
| Magana Family Trust | -- | None Listed On Document | |
| Magana Ruben | $215,000 | Chicago Title Company | |
| Wachovia Mortgage Fsb | $69,891 | Accommodation | |
| Montellano Ofelia | $389,500 | North American Title |
Source: Public Records
Mortgage History
| Date | Status | Borrower | Loan Amount |
|---|---|---|---|
| Previous Owner | Magana Ruben | $211,105 | |
| Previous Owner | Montellano Ofelia | $311,329 |
Source: Public Records
Tax History
| Year | Tax Paid | Tax Assessment Tax Assessment Total Assessment is a certain percentage of the fair market value that is determined by local assessors to be the total taxable value of land and additions on the property. | Land | Improvement |
|---|---|---|---|---|
| 2025 | $3,737 | $277,512 | $64,533 | $212,979 |
| 2024 | $3,653 | $272,071 | $63,268 | $208,803 |
| 2023 | $3,653 | $266,737 | $62,028 | $204,709 |
| 2022 | $3,596 | $261,508 | $60,812 | $200,696 |
| 2021 | $3,470 | $256,381 | $59,620 | $196,761 |
| 2020 | $3,413 | $253,753 | $59,009 | $194,744 |
| 2019 | $3,357 | $253,753 | $59,009 | $194,744 |
| 2018 | $3,281 | $243,901 | $56,718 | $187,183 |
| 2017 | $3,234 | $239,119 | $55,606 | $183,513 |
| 2016 | $3,050 | $234,431 | $54,516 | $179,915 |
| 2015 | $3,005 | $230,911 | $53,698 | $177,213 |
| 2014 | $2,939 | $226,389 | $52,647 | $173,742 |
Source: Public Records
Map
Nearby Homes
- 14616 Tralee Dr
- 18 Claudia Autumn Dr
- 300 Solecita Way
- 15 Claudia Autumn Dr
- 14812 Lemon Lily Dr
- 14917 Aldridge Ave
- 14308 San Jose Ave
- 309 Sonoma Vine Ct
- 214 Irish Crystal Ct
- 308 White Alder Dr
- 509 Jewel Flower St
- 1215 Brookline Ln
- 14016 Las Entradas
- 14600 Central Coast St
- 14013 Las Entradas
- 401 Corte Mismo
- 14908 Central Coast St
- 601 Hidalgo Dr
- 14508 Checkerbloom Dr
- 207 Riesling Vines St
- 14604 Tralee Dr
- 14612 Tralee Dr
- 14611 Madison Michelle Way
- 14600 Tralee Dr
- 14615 Madison Michelle Way
- 14607 Madison Michelle Way
- 33 Belfast Ct
- 14603 Madison Michelle Way
- 14619 Madison Michelle Way
- 22 Ulysses Ct
- 14510 Tralee Dr
- 14702 Tralee Dr
- 29 Belfast Ct
- 14701 Madison Michelle Way
- 14513 Madison Michelle Way
- 18 Ulysses Ct
- 32 Belfast Ct
- 14506 Tralee Dr
- 14706 Tralee Dr
- 14509 Madison Michelle Way
Your Personal Tour Guide
Ask me questions while you tour the home.