Estimated Value: $442,225 - $468,000
3
Beds
3
Baths
1,724
Sq Ft
$264/Sq Ft
Est. Value
About This Home
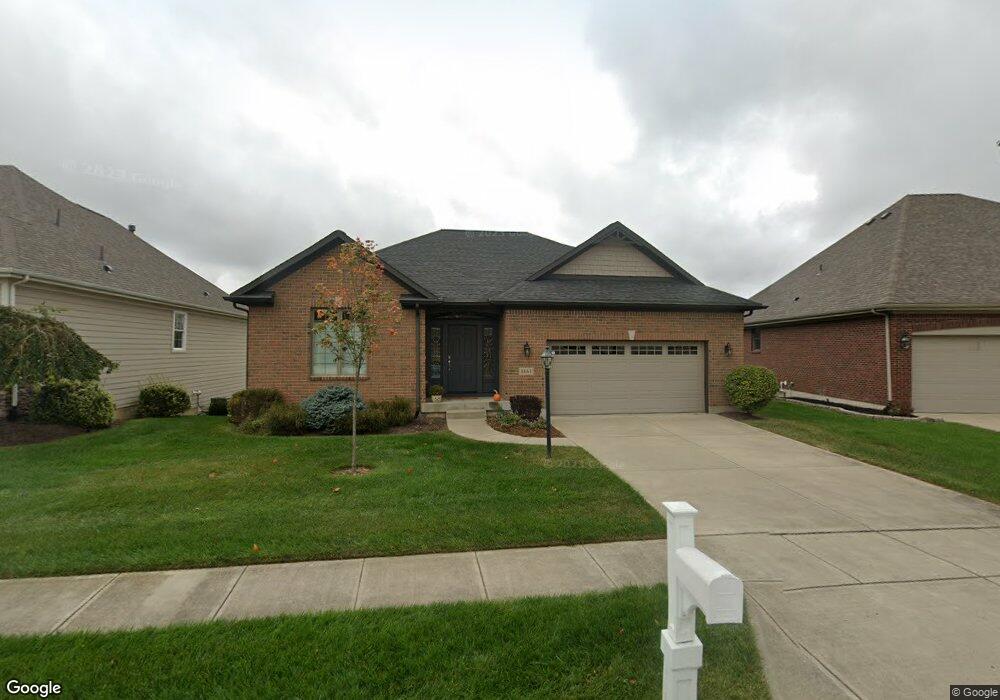
This home is located at 1461 Audubon Ln, Xenia, OH 45385 and is currently estimated at $455,056, approximately $263 per square foot. 1461 Audubon Ln is a home with nearby schools including Trebein Elementary School, Jacob Coy Middle School, and Beavercreek High School.
Ownership History
Date
Name
Owned For
Owner Type
Purchase Details
Closed on
Dec 31, 2015
Bought by
Mclane James S
Current Estimated Value
Purchase Details
Closed on
Oct 22, 2014
Sold by
Mclane James Steven and Mclane Jerilyn S
Bought by
Jerilyn S Mclane Living Trust
Home Financials for this Owner
Home Financials are based on the most recent Mortgage that was taken out on this home.
Original Mortgage
$269,200
Interest Rate
2.75%
Mortgage Type
Adjustable Rate Mortgage/ARM
Purchase Details
Closed on
Feb 10, 2014
Sold by
Great Lakes Ira Llc
Bought by
Security National Bank and Gary M Heeb Sdira A2934
Purchase Details
Closed on
Sep 6, 2007
Sold by
Stonehill Development Ltd
Bought by
Entrust Great Lakes Llc and Gary Michael Heeb Ira
Create a Home Valuation Report for This Property
The Home Valuation Report is an in-depth analysis detailing your home's value as well as a comparison with similar homes in the area
Home Values in the Area
Average Home Value in this Area
Purchase History
| Date | Buyer | Sale Price | Title Company |
|---|---|---|---|
| Mclane James S | -- | -- | |
| Jerilyn S Mclane Living Trust | -- | None Available | |
| Mclane James Steven | $60,000 | None Available | |
| Security National Bank | -- | None Available | |
| Entrust Great Lakes Llc | $53,200 | None Available |
Source: Public Records
Mortgage History
| Date | Status | Borrower | Loan Amount |
|---|---|---|---|
| Previous Owner | Mclane James Steven | $269,200 |
Source: Public Records
Tax History Compared to Growth
Tax History
| Year | Tax Paid | Tax Assessment Tax Assessment Total Assessment is a certain percentage of the fair market value that is determined by local assessors to be the total taxable value of land and additions on the property. | Land | Improvement |
|---|---|---|---|---|
| 2024 | $7,907 | $137,670 | $21,460 | $116,210 |
| 2023 | $7,907 | $137,670 | $21,460 | $116,210 |
| 2022 | $7,312 | $111,630 | $18,660 | $92,970 |
| 2021 | $7,385 | $111,630 | $18,660 | $92,970 |
| 2020 | $7,420 | $111,630 | $18,660 | $92,970 |
| 2019 | $7,220 | $99,750 | $17,920 | $81,830 |
| 2018 | $6,313 | $99,750 | $17,920 | $81,830 |
| 2017 | $6,195 | $99,750 | $17,920 | $81,830 |
| 2016 | $6,011 | $93,670 | $15,680 | $77,990 |
| 2015 | $506 | $15,680 | $15,680 | $0 |
| 2014 | $495 | $15,680 | $15,680 | $0 |
Source: Public Records
Map
Nearby Homes
- 1462 Champions Way
- 1382 Prestonwood Ct S
- 1247 Homestead Dr
- 1678 Fairground Rd
- Torino II Plan at The Courtyards at Stonehill Village
- Palazzo Plan at The Courtyards at Stonehill Village
- Promenade III Plan at The Courtyards at Stonehill Village
- Portico Plan at The Courtyards at Stonehill Village
- Verona Plan at The Courtyards at Stonehill Village
- 1427 Triple Crown Way
- 1590 Windham Ln
- 1121 Westover Rd
- 1589 Stonebury Ct
- 1416 Hilltop Rd
- 1481 Stone Ridge Ct
- 2073 Lincolnshire Dr
- 1238 Freedom Point
- 1535 Stretch Dr
- 2162 Sulky Trail
- 2067 Codaz Way
- 1465 Audubon Ln
- 1457 Audubon Ln
- 1451 Audubon Ln
- 0 Audubon Ln Unit 69 406185
- 1458 Audubon Ln
- 1447 Audubon Ln
- 1462 Runnymeade Way
- 1466 Runnymeade Way
- 1473 Foxtale Ct
- 1441 Audubon Ln
- 1454 Runnymeade Way
- 1470 Runnymeade Way
- 1450 Runnymeade Way
- 0 Lot 80 Foxtale Ct Unit 617388
- 0 Lot 80 Foxtale Ct Unit 830605
- 0 Lot 80 Foxtale Ct Unit 778852
- 1437 Audubon Ln
- 1469 Foxtale Ct
- 1474 Runnymeade Way
- 1444 Runnymeade Way