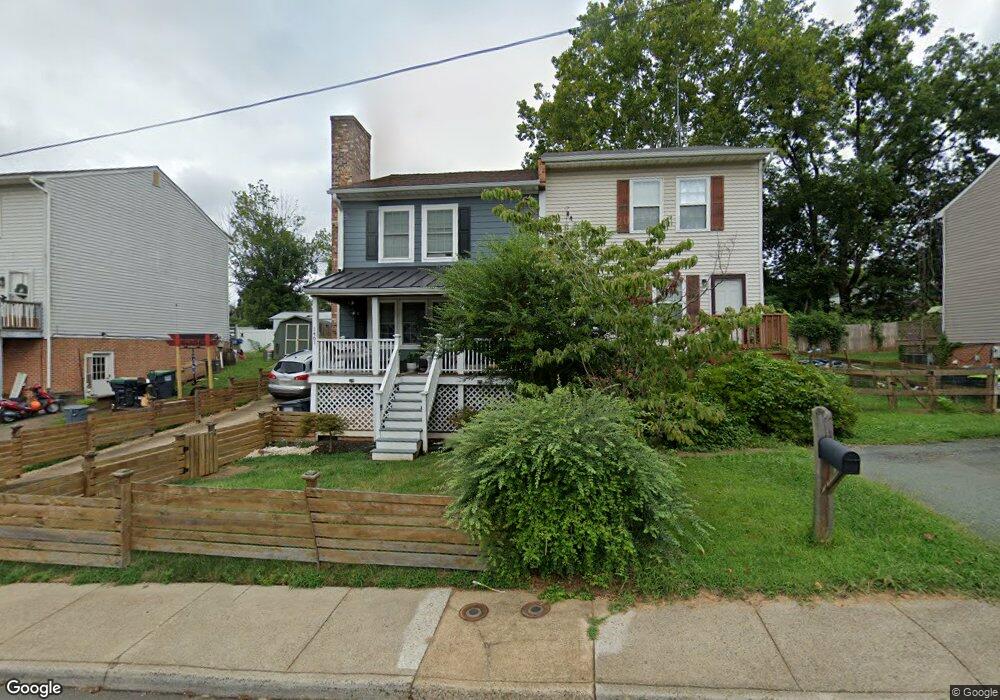
1461 Avon St Unit 1461 Charlottesville, VA 22902
Belmont NeighborhoodEstimated Value: $418,430 - $458,000
3
Beds
2
Baths
1,296
Sq Ft
$333/Sq Ft
Est. Value
About This Home
This home is located at 1461 Avon St Unit 1461, Charlottesville, VA 22902 and is currently estimated at $431,108, approximately $332 per square foot. 1461 Avon St Unit 1461 is a home located in Charlottesville City with nearby schools including Jackson-Via Elementary School, Buford Middle School, and Charlottesville High School.
Ownership History
Date
Name
Owned For
Owner Type
Purchase Details
Closed on
Jan 14, 2020
Sold by
Chowdhry Jay C
Bought by
Powell Joshua D and Powell Xiaolong Sha
Current Estimated Value
Home Financials for this Owner
Home Financials are based on the most recent Mortgage that was taken out on this home.
Original Mortgage
$232,800
Outstanding Balance
$206,202
Interest Rate
3.73%
Mortgage Type
New Conventional
Estimated Equity
$224,906
Purchase Details
Closed on
Oct 24, 2012
Bought by
Chowdhry Jay C
Create a Home Valuation Report for This Property
The Home Valuation Report is an in-depth analysis detailing your home's value as well as a comparison with similar homes in the area
Home Values in the Area
Average Home Value in this Area
Purchase History
| Date | Buyer | Sale Price | Title Company |
|---|---|---|---|
| Powell Joshua D | $291,000 | Chicago Title Ins Co | |
| Chowdhry Jay C | $149,900 | -- |
Source: Public Records
Mortgage History
| Date | Status | Borrower | Loan Amount |
|---|---|---|---|
| Open | Powell Joshua D | $232,800 |
Source: Public Records
Tax History Compared to Growth
Tax History
| Year | Tax Paid | Tax Assessment Tax Assessment Total Assessment is a certain percentage of the fair market value that is determined by local assessors to be the total taxable value of land and additions on the property. | Land | Improvement |
|---|---|---|---|---|
| 2025 | $4,137 | $414,800 | $84,200 | $330,600 |
| 2024 | $4,137 | $385,100 | $76,500 | $308,600 |
| 2023 | $3,615 | $369,100 | $69,500 | $299,600 |
| 2022 | $3,169 | $322,600 | $66,200 | $256,400 |
| 2021 | $2,834 | $290,700 | $57,600 | $233,100 |
| 2020 | $1,992 | $202,100 | $54,900 | $147,200 |
| 2019 | $2,100 | $213,500 | $54,900 | $158,600 |
| 2018 | $940 | $190,400 | $49,900 | $140,500 |
| 2017 | $1,752 | $176,800 | $46,700 | $130,100 |
| 2016 | $1,653 | $166,400 | $38,900 | $127,500 |
| 2015 | $1,564 | $154,800 | $38,900 | $115,900 |
| 2014 | $1,564 | $154,800 | $38,900 | $115,900 |
Source: Public Records
Map
Nearby Homes