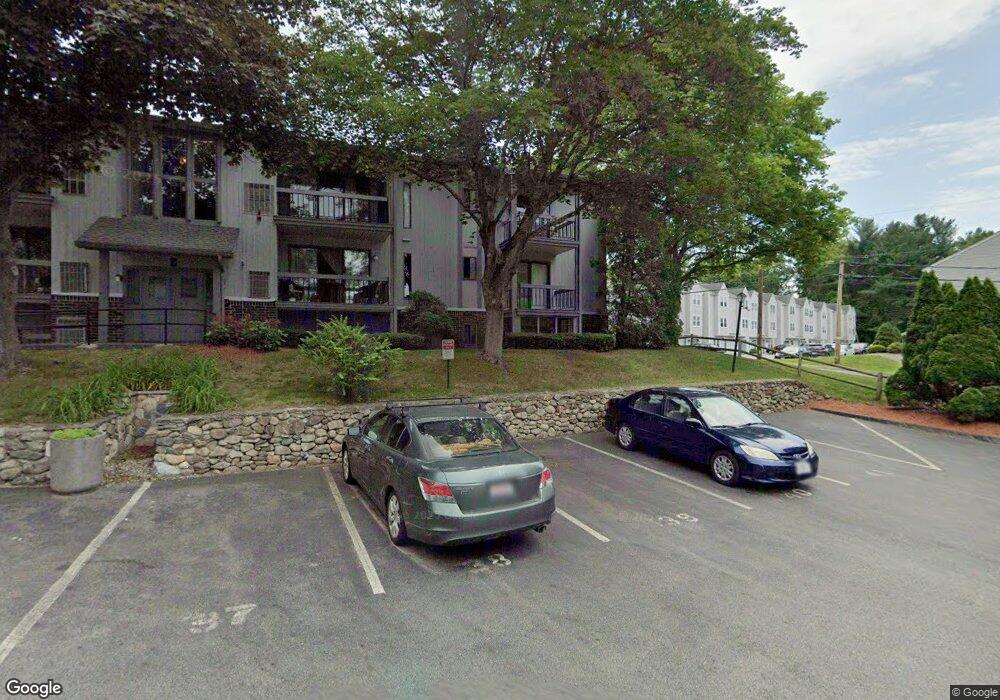
1461 Pawtucket Blvd Unit 65 Lowell, MA 01854
Pawtucketville NeighborhoodEstimated Value: $276,000 - $306,852
2
Beds
2
Baths
1,202
Sq Ft
$245/Sq Ft
Est. Value
About This Home
This home is located at 1461 Pawtucket Blvd Unit 65, Lowell, MA 01854 and is currently estimated at $294,213, approximately $244 per square foot. 1461 Pawtucket Blvd Unit 65 is a home located in Middlesex County with nearby schools including Joseph McAvinnue Elementary School, Charlotte M. Murkland Elementary School, and Charles W. Morey Elementary School.
Ownership History
Date
Name
Owned For
Owner Type
Purchase Details
Closed on
Apr 30, 2010
Sold by
Taylor James S
Bought by
Ahn Sung
Current Estimated Value
Home Financials for this Owner
Home Financials are based on the most recent Mortgage that was taken out on this home.
Original Mortgage
$89,250
Outstanding Balance
$59,645
Interest Rate
4.99%
Mortgage Type
Purchase Money Mortgage
Estimated Equity
$234,568
Purchase Details
Closed on
Feb 3, 2009
Sold by
Dequeiroz Adriane A
Bought by
Hsbc Mortgage Svcs Inc
Purchase Details
Closed on
Oct 27, 2005
Sold by
Osgood Scott E
Bought by
Dequeiroz Adriane A
Home Financials for this Owner
Home Financials are based on the most recent Mortgage that was taken out on this home.
Original Mortgage
$171,920
Interest Rate
5.79%
Mortgage Type
Purchase Money Mortgage
Create a Home Valuation Report for This Property
The Home Valuation Report is an in-depth analysis detailing your home's value as well as a comparison with similar homes in the area
Home Values in the Area
Average Home Value in this Area
Purchase History
| Date | Buyer | Sale Price | Title Company |
|---|---|---|---|
| Ahn Sung | $119,000 | -- | |
| Hsbc Mortgage Svcs Inc | $76,000 | -- | |
| Dequeiroz Adriane A | $214,900 | -- |
Source: Public Records
Mortgage History
| Date | Status | Borrower | Loan Amount |
|---|---|---|---|
| Open | Ahn Sung | $89,250 | |
| Previous Owner | Dequeiroz Adriane A | $171,920 |
Source: Public Records
Tax History Compared to Growth
Tax History
| Year | Tax Paid | Tax Assessment Tax Assessment Total Assessment is a certain percentage of the fair market value that is determined by local assessors to be the total taxable value of land and additions on the property. | Land | Improvement |
|---|---|---|---|---|
| 2025 | $2,894 | $252,100 | $0 | $252,100 |
| 2024 | $3,099 | $260,200 | $0 | $260,200 |
| 2023 | $2,854 | $229,800 | $0 | $229,800 |
| 2022 | $2,711 | $213,600 | $0 | $213,600 |
| 2021 | $2,448 | $181,900 | $0 | $181,900 |
| 2020 | $2,048 | $153,300 | $0 | $153,300 |
| 2019 | $1,980 | $141,000 | $0 | $141,000 |
| 2018 | $2,035 | $129,400 | $0 | $129,400 |
| 2017 | $2,008 | $134,600 | $0 | $134,600 |
| 2016 | $1,903 | $125,500 | $0 | $125,500 |
| 2015 | $1,743 | $112,600 | $0 | $112,600 |
| 2013 | $1,816 | $121,000 | $0 | $121,000 |
Source: Public Records
Map
Nearby Homes
- 15 Dowling Dr
- 1461 Pawtucket Blvd Unit 12
- 1370 Varnum Ave
- 1401 Pawtucket Blvd Unit 10
- 730 Wellman Ave
- 271 Wellman Ave
- 251 Wellman Ave Unit 251
- 739 Wellman Ave
- 330 Wellman Ave
- 20 Sandy Ln
- 436 Wellman Ave
- 10 Butterfield St
- 863 Wellman Ave Unit 863
- 6 Louis Farm Rd Unit 6
- 3 Louis Farm Rd Unit 3
- 33 Kennedy Dr Unit 33
- 16 Middlesex St Unit 4
- 49 Coburn Dr
- 29 Middlesex St Unit 1
- 69 Coburn Dr
- 1461 Pawtucket Blvd Unit A-1
- 1461 Pawtucket Blvd Unit Bldg E U 10
- 1461 Pawtucket Blvd Unit F-8 or 6-8
- 1461 Pawtucket Blvd Unit F-6
- 1461 Pawtucket Blvd Unit B-10
- 1461 Pawtucket Blvd Unit F-4
- 1461 Pawtucket Blvd Unit 112
- 1461 Pawtucket Blvd Unit 17
- 1461 Pawtucket Blvd Unit 111
- 1461 Pawtucket Blvd Unit 110
- 1461 Pawtucket Blvd Unit 612
- 1461 Pawtucket Blvd Unit 611
- 1461 Pawtucket Blvd Unit 610
- 1461 Pawtucket Blvd Unit 69
- 1461 Pawtucket Blvd Unit 68
- 1461 Pawtucket Blvd Unit 67
- 1461 Pawtucket Blvd Unit 66
- 1461 Pawtucket Blvd Unit 64
- 1461 Pawtucket Blvd Unit 62
- 1461 Pawtucket Blvd Unit 61