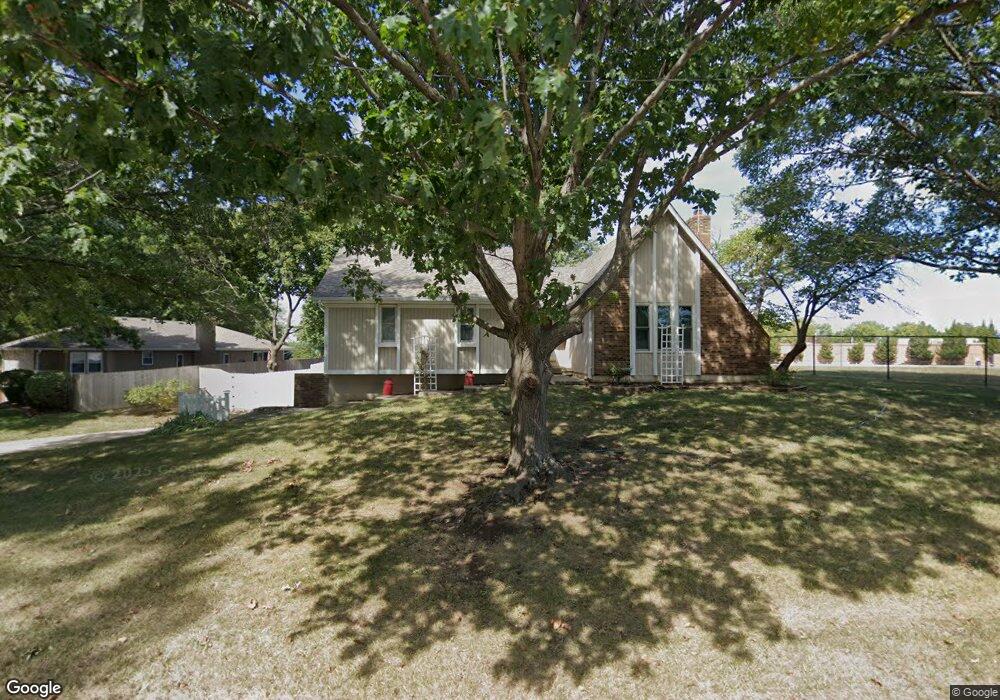
14612 W 60th Terrace Shawnee, KS 66216
Estimated Value: $357,000 - $382,000
3
Beds
3
Baths
1,462
Sq Ft
$249/Sq Ft
Est. Value
About This Home
This home is located at 14612 W 60th Terrace, Shawnee, KS 66216 and is currently estimated at $364,170, approximately $249 per square foot. 14612 W 60th Terrace is a home located in Johnson County with nearby schools including Broken Arrow Elementary School, Trailridge Middle School, and Shawnee Mission Northwest High School.
Ownership History
Date
Name
Owned For
Owner Type
Purchase Details
Closed on
Nov 14, 2020
Sold by
Murphy Peggy E
Bought by
Murrphy Peggy E
Current Estimated Value
Home Financials for this Owner
Home Financials are based on the most recent Mortgage that was taken out on this home.
Original Mortgage
$170,000
Outstanding Balance
$150,930
Interest Rate
2.8%
Mortgage Type
New Conventional
Estimated Equity
$213,240
Purchase Details
Closed on
Sep 20, 2017
Sold by
Murphy Peggy E and Perez Frederick L
Bought by
Murphy Peggy E
Home Financials for this Owner
Home Financials are based on the most recent Mortgage that was taken out on this home.
Original Mortgage
$172,800
Interest Rate
3.86%
Mortgage Type
New Conventional
Purchase Details
Closed on
Aug 2, 2001
Sold by
Worrall Kirk A and Worrall Judith R
Bought by
Murphy Timothy O and Murphy Peggy E
Home Financials for this Owner
Home Financials are based on the most recent Mortgage that was taken out on this home.
Original Mortgage
$85,000
Interest Rate
7.07%
Create a Home Valuation Report for This Property
The Home Valuation Report is an in-depth analysis detailing your home's value as well as a comparison with similar homes in the area
Home Values in the Area
Average Home Value in this Area
Purchase History
| Date | Buyer | Sale Price | Title Company |
|---|---|---|---|
| Murrphy Peggy E | -- | None Available | |
| Murphy Peggy E | -- | Clear Title | |
| Murphy Peggy E | -- | Clear Title | |
| Murphy Timothy O | -- | Security Land Title Agency |
Source: Public Records
Mortgage History
| Date | Status | Borrower | Loan Amount |
|---|---|---|---|
| Open | Murrphy Peggy E | $170,000 | |
| Closed | Murphy Peggy E | $172,800 | |
| Previous Owner | Murphy Timothy O | $85,000 |
Source: Public Records
Tax History Compared to Growth
Tax History
| Year | Tax Paid | Tax Assessment Tax Assessment Total Assessment is a certain percentage of the fair market value that is determined by local assessors to be the total taxable value of land and additions on the property. | Land | Improvement |
|---|---|---|---|---|
| 2024 | $3,785 | $35,869 | $6,984 | $28,885 |
| 2023 | $3,646 | $34,029 | $6,644 | $27,385 |
| 2022 | $3,216 | $29,923 | $6,039 | $23,884 |
| 2021 | $3,130 | $27,266 | $5,492 | $21,774 |
| 2020 | $3,030 | $26,048 | $4,990 | $21,058 |
| 2019 | $2,826 | $24,265 | $4,326 | $19,939 |
| 2018 | $2,587 | $22,114 | $4,326 | $17,788 |
| 2017 | $2,510 | $21,114 | $3,769 | $17,345 |
| 2016 | $2,459 | $20,424 | $3,769 | $16,655 |
| 2015 | $2,225 | $19,240 | $3,769 | $15,471 |
| 2013 | -- | $18,354 | $3,769 | $14,585 |
Source: Public Records
Map
Nearby Homes
- 5826 Oakview St
- 14214 W 63rd St
- 14204 W 63rd St
- 5633 Oakview St
- 5713 Widmer Rd
- 6143 Park St
- 6145 Park St
- 14406 W 65th Terrace
- 5703 Cottonwood St
- 5502 Mullen Rd
- 5530 Rene St
- 5919 Pflumm Rd
- 4908 Noland Rd
- 5807 Noland Rd
- 5507 Noland Rd
- 13810 W 53rd St
- 6640 Pflumm Rd
- 13415 W 66th Terrace
- 5300 Summit Ct
- 180 Terrace Trail S
- 6011 Alden St
- 14611 W 60th Terrace
- 14605 W 60th Terrace
- 14520 W 60th Terrace
- 6015 Alden St
- 14519 W 60th Terrace
- 14514 W 60th Terrace
- 6021 Alden St
- 14604 W 60th Place
- 14608 W 60th Place
- 14515 W 60th Terrace
- 14512 W 60th Terrace
- 6025 Alden St
- 14522 W 60th Place
- 5980 Alden St
- 14511 W 60th Terrace
- 6020 Alden St
- 14516 W 60th Place
- 6029 Alden St
- 6006 Greenwood St