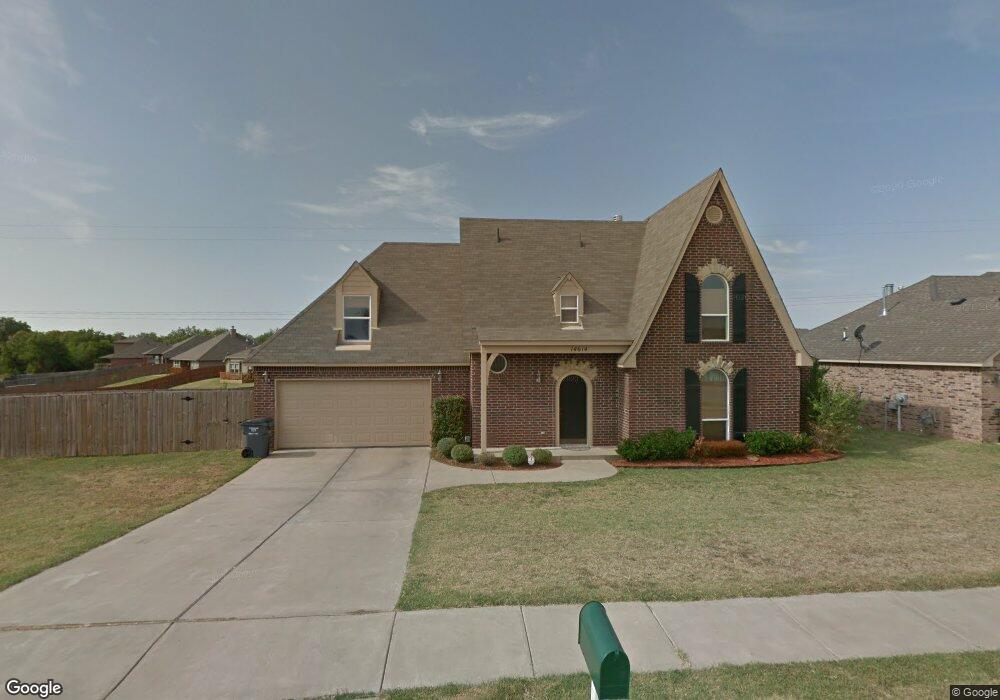
14614 S Kendalwood Blvd Glenpool, OK 74033
Estimated Value: $267,000 - $281,000
4
Beds
3
Baths
1,650
Sq Ft
$165/Sq Ft
Est. Value
About This Home
This home is located at 14614 S Kendalwood Blvd, Glenpool, OK 74033 and is currently estimated at $271,998, approximately $164 per square foot. 14614 S Kendalwood Blvd is a home located in Tulsa County with nearby schools including Glenpool Elementary School, Glenpool Middle School, and Glenpool High School.
Ownership History
Date
Name
Owned For
Owner Type
Purchase Details
Closed on
Sep 18, 2018
Sold by
Burns Gerard T and Burns Carla P
Bought by
Wiley Steven
Current Estimated Value
Home Financials for this Owner
Home Financials are based on the most recent Mortgage that was taken out on this home.
Original Mortgage
$168,000
Outstanding Balance
$145,919
Interest Rate
4.6%
Mortgage Type
VA
Estimated Equity
$126,079
Purchase Details
Closed on
Oct 23, 2007
Sold by
Smith Lorin H and Smith Janet E
Bought by
Burns Gerard T and Burns Carla P
Home Financials for this Owner
Home Financials are based on the most recent Mortgage that was taken out on this home.
Original Mortgage
$150,604
Interest Rate
6.37%
Mortgage Type
FHA
Purchase Details
Closed on
Jan 18, 2006
Sold by
First Equity Corp
Bought by
Smith Lorin H and Smith Janet E
Create a Home Valuation Report for This Property
The Home Valuation Report is an in-depth analysis detailing your home's value as well as a comparison with similar homes in the area
Home Values in the Area
Average Home Value in this Area
Purchase History
| Date | Buyer | Sale Price | Title Company |
|---|---|---|---|
| Wiley Steven | $168,000 | American Abstract & Title Co | |
| Burns Gerard T | $152,000 | Frisco Title Corporation | |
| Smith Lorin H | $9,000 | Residential Title | |
| Smith Lorin H | $9,000 | Residential Title |
Source: Public Records
Mortgage History
| Date | Status | Borrower | Loan Amount |
|---|---|---|---|
| Open | Wiley Steven | $168,000 | |
| Previous Owner | Burns Gerard T | $150,604 |
Source: Public Records
Tax History Compared to Growth
Tax History
| Year | Tax Paid | Tax Assessment Tax Assessment Total Assessment is a certain percentage of the fair market value that is determined by local assessors to be the total taxable value of land and additions on the property. | Land | Improvement |
|---|---|---|---|---|
| 2024 | $2,385 | $21,393 | $3,036 | $18,357 |
| 2023 | $2,385 | $20,375 | $3,059 | $17,316 |
| 2022 | $2,236 | $19,404 | $3,673 | $15,731 |
| 2021 | $2,163 | $18,480 | $3,498 | $14,982 |
| 2020 | $2,179 | $18,480 | $3,498 | $14,982 |
| 2019 | $2,194 | $18,480 | $3,498 | $14,982 |
| 2018 | $1,977 | $16,723 | $3,301 | $13,422 |
| 2017 | $1,934 | $17,723 | $3,498 | $14,225 |
| 2016 | $1,954 | $17,723 | $3,498 | $14,225 |
| 2015 | $1,885 | $17,723 | $3,498 | $14,225 |
| 2014 | $1,835 | $16,720 | $3,300 | $13,420 |
Source: Public Records
Map
Nearby Homes
- 1329 E 146th Place S
- 14603 S Nyssa Place
- 14468 S Poplar St
- 14529 S Nyssa Place
- 1212 E 146th St S
- 14659 S Nyssa Place
- 14447 S Oklahoma Blvd
- 1441 E 149th Place S
- 14940 S Poplar St
- 14969 S Poplar Place
- 15025 S Oak St
- 15013 S Oak St
- 1323 E 143rd St
- 1122 E 144th Place
- 14951 S Poplar Place
- Jacqueline Plan at Scissortail Park - Wellington Collection
- Abigail Plan at Scissortail Park - Wellington Collection
- Adams Plan at Scissortail Park - Wellington Collection
- Reagan Plus Plan at Scissortail Park - Wellington Collection
- 1404 E 149th Place S
- 14614 Kendalwood Ave
- 14608 Kendalwood Ave
- 14608 S Kendalwood Blvd
- 14615 S Poplar St
- 14602 S Kendalwood Blvd
- 14602 Kendalwood Ave
- 14607 S Poplar St
- 14601 S Poplar St
- 14621 S Poplar St
- 14605 Kendalwood Ave
- 14605 Kendalwood Ave
- 14568 Kendalwood Ave
- 14571 S Kendalwood Blvd
- 14568 S Kendalwood Blvd
- 14571 Kendalwood Ave
- 14625 S Poplar St
- 14565 Kendalwood Ave
- 14565 S Kendalwood Blvd
- 14612 S Poplar St
- 14562 Kendalwood Ave