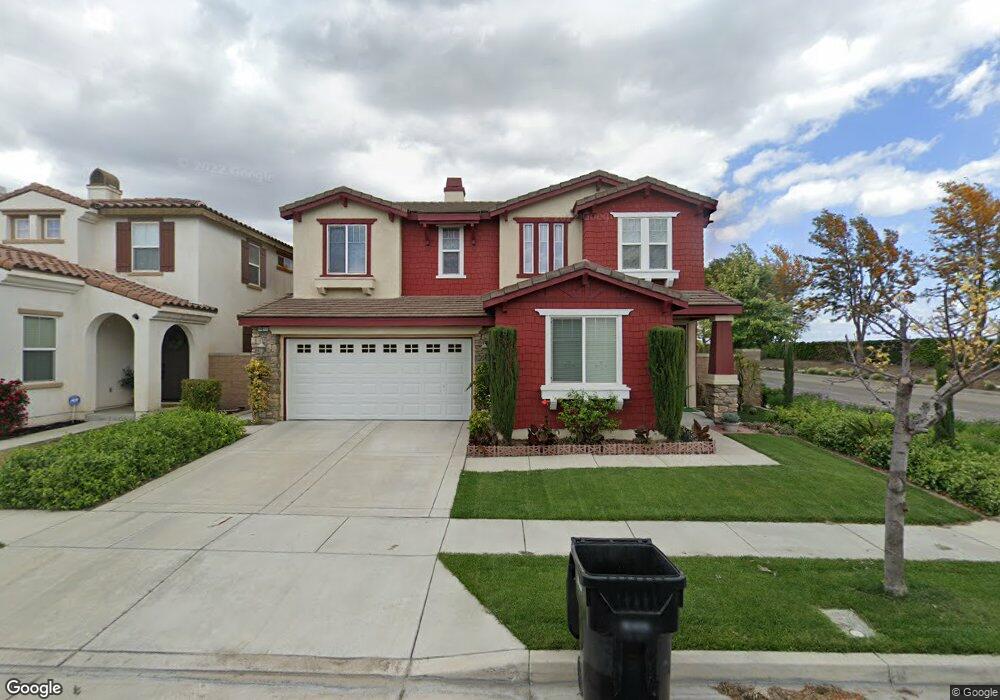
14617 Excelsior Ave Chino, CA 91710
College Park NeighborhoodEstimated Value: $846,417 - $898,000
4
Beds
3
Baths
2,687
Sq Ft
$327/Sq Ft
Est. Value
About This Home
This home is located at 14617 Excelsior Ave, Chino, CA 91710 and is currently estimated at $878,854, approximately $327 per square foot. 14617 Excelsior Ave is a home located in San Bernardino County with nearby schools including Edwin Rhodes Elementary, Magnolia Junior High, and Chino High School.
Ownership History
Date
Name
Owned For
Owner Type
Purchase Details
Closed on
Oct 31, 2012
Sold by
Liu Jack X
Bought by
Liu Jack X and Yan Lora X
Current Estimated Value
Home Financials for this Owner
Home Financials are based on the most recent Mortgage that was taken out on this home.
Original Mortgage
$315,000
Outstanding Balance
$214,954
Interest Rate
3.43%
Mortgage Type
New Conventional
Estimated Equity
$663,900
Purchase Details
Closed on
Oct 21, 2009
Sold by
Stg College Park Llc
Bought by
Liu Jack X and Yan Lora X
Home Financials for this Owner
Home Financials are based on the most recent Mortgage that was taken out on this home.
Original Mortgage
$333,906
Interest Rate
3.75%
Mortgage Type
New Conventional
Purchase Details
Closed on
Aug 13, 2008
Sold by
California Bank & Trust
Bought by
Stg College Park Llc
Purchase Details
Closed on
Aug 4, 2008
Sold by
Pinnacle College Park Pa 4 Llc
Bought by
California Bank & Trust
Create a Home Valuation Report for This Property
The Home Valuation Report is an in-depth analysis detailing your home's value as well as a comparison with similar homes in the area
Home Values in the Area
Average Home Value in this Area
Purchase History
| Date | Buyer | Sale Price | Title Company |
|---|---|---|---|
| Liu Jack X | -- | Chicago Title Company | |
| Liu Jack X | $417,500 | First American Title Company | |
| Stg College Park Llc | -- | First American Title Company | |
| California Bank & Trust | $4,720,000 | Accommodation |
Source: Public Records
Mortgage History
| Date | Status | Borrower | Loan Amount |
|---|---|---|---|
| Open | Liu Jack X | $315,000 | |
| Previous Owner | Liu Jack X | $333,906 |
Source: Public Records
Tax History
| Year | Tax Paid | Tax Assessment Tax Assessment Total Assessment is a certain percentage of the fair market value that is determined by local assessors to be the total taxable value of land and additions on the property. | Land | Improvement |
|---|---|---|---|---|
| 2025 | $11,154 | $538,765 | $154,898 | $383,867 |
| 2024 | $10,995 | $528,201 | $151,861 | $376,340 |
| 2023 | $10,834 | $517,844 | $148,883 | $368,961 |
| 2022 | $10,799 | $507,690 | $145,964 | $361,726 |
| 2021 | $10,689 | $497,735 | $143,102 | $354,633 |
| 2020 | $10,618 | $492,632 | $141,635 | $350,997 |
| 2019 | $10,522 | $482,973 | $138,858 | $344,115 |
| 2018 | $10,403 | $473,503 | $136,135 | $337,368 |
| 2017 | $10,310 | $464,219 | $133,466 | $330,753 |
| 2016 | $9,975 | $455,117 | $130,849 | $324,268 |
| 2015 | $9,878 | $448,281 | $128,884 | $319,397 |
| 2014 | $9,785 | $439,499 | $126,359 | $313,140 |
Source: Public Records
Map
Nearby Homes
- 14609 Mckendree Ave
- 14591 Westfield Ave
- 14587 Baylor Ave
- 6746 Edinboro St
- 6641 Eucalyptus Ave
- 6550 Eucalyptus Ave
- 6956 Larochelle Way
- 14415 Figueroa Ln
- 14349 Guilford Ave
- 6227 Satterfield Way
- 14433 Penn Foster St
- 6049 Grace St
- 14538 Hillsdale St
- 14421 Penn Foster St
- 14693 Marquette Ave
- 14487 Hillsdale St
- 6081 Satterfield Way
- 6069 Satterfield Way
- 6053 Satterfield Way
- 6935 Frontier St
- 14611 Excelsior Ave
- 14616 Tuskegee Ave
- 14610 Tuskegee Ave
- 14607 Excelsior Ave
- 14602 Tuskegee Ave
- 14618 Excelsior Ave
- 14612 Excelsior Ave
- 14601 Excelsior Ave
- 14608 Excelsior Ave
- 14598 Tuskegee Ave
- 14595 Excelsior Ave
- 14602 Excelsior Ave
- 14615 Mckendree Ave
- 14615 Tuskegee Ave
- 14592 Tuskegee Ave
- 14609 Tuskegee Ave
- 14605 Tuskegee Ave
- 14605 Mckendree Ave
- 14598 Excelsior Ave
- 14591 Excelsior Ave
Your Personal Tour Guide
Ask me questions while you tour the home.