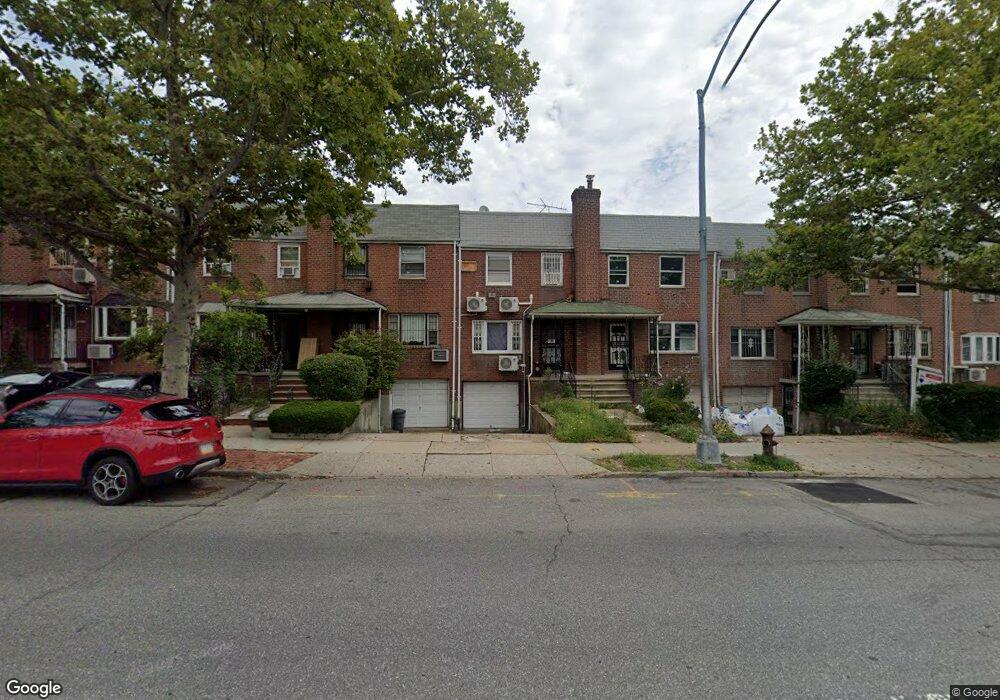
14619 Horace Harding Expy Flushing, NY 11367
Flushing NeighborhoodEstimated Value: $949,306 - $1,216,000
--
Bed
--
Bath
1,620
Sq Ft
$655/Sq Ft
Est. Value
About This Home
This home is located at 14619 Horace Harding Expy, Flushing, NY 11367 and is currently estimated at $1,061,577, approximately $655 per square foot. 14619 Horace Harding Expy is a home located in Queens County with nearby schools including P.S. 163 - Flushing Heights, Rachel Carson I.S. 237Q, and John Bowne High School.
Ownership History
Date
Name
Owned For
Owner Type
Purchase Details
Closed on
Mar 7, 2022
Sold by
Kong Ben Yuk Man and Kong Daniel Yuk
Bought by
Li Jia and Li Mei Xin
Current Estimated Value
Home Financials for this Owner
Home Financials are based on the most recent Mortgage that was taken out on this home.
Original Mortgage
$652,000
Outstanding Balance
$608,972
Interest Rate
3.89%
Mortgage Type
Purchase Money Mortgage
Estimated Equity
$452,605
Purchase Details
Closed on
May 24, 2021
Sold by
Gianatiempo Patricia
Bought by
Ying Kimberly
Purchase Details
Closed on
Dec 10, 2020
Sold by
Mittler Peter
Bought by
Chu-San Ying Kimberly and Yu Miranda Yuk
Purchase Details
Closed on
Jun 5, 2003
Sold by
Kong Ben Yuk Man and Kong Yuk Ching
Bought by
Kong Ben Yuk Man and Kong Yuk Bun
Create a Home Valuation Report for This Property
The Home Valuation Report is an in-depth analysis detailing your home's value as well as a comparison with similar homes in the area
Home Values in the Area
Average Home Value in this Area
Purchase History
| Date | Buyer | Sale Price | Title Company |
|---|---|---|---|
| Li Jia | $870,000 | -- | |
| Li Jia | $870,000 | -- | |
| Ying Kimberly | $258,000 | -- | |
| Chu-San Ying Kimberly | $265,000 | -- | |
| Kong Ben Yuk Man | -- | -- | |
| Kong Ben Yuk Man | -- | -- |
Source: Public Records
Mortgage History
| Date | Status | Borrower | Loan Amount |
|---|---|---|---|
| Open | Li Jia | $652,000 | |
| Closed | Li Jia | $652,000 |
Source: Public Records
Tax History Compared to Growth
Tax History
| Year | Tax Paid | Tax Assessment Tax Assessment Total Assessment is a certain percentage of the fair market value that is determined by local assessors to be the total taxable value of land and additions on the property. | Land | Improvement |
|---|---|---|---|---|
| 2025 | $8,769 | $43,660 | $7,150 | $36,510 |
| 2024 | $8,769 | $43,660 | $7,560 | $36,100 |
| 2023 | $6,745 | $33,583 | $6,384 | $27,199 |
| 2022 | $4,744 | $52,440 | $10,140 | $42,300 |
| 2021 | $5,975 | $56,100 | $10,140 | $45,960 |
| 2020 | $5,652 | $55,380 | $10,140 | $45,240 |
| 2019 | $5,585 | $53,160 | $10,140 | $43,020 |
| 2018 | $5,399 | $27,986 | $4,963 | $23,023 |
| 2017 | $5,076 | $26,403 | $5,592 | $20,811 |
| 2016 | $4,680 | $26,403 | $5,592 | $20,811 |
| 2015 | -- | $23,500 | $6,674 | $16,826 |
| 2014 | -- | $23,500 | $7,327 | $16,173 |
Source: Public Records
Map
Nearby Homes
- 148-03 Horace Harding Expy
- 146-12 61st Rd
- 14803 61st Rd
- 14850 60th Ave
- 5707 146th St
- 148-40 61st Rd
- 138-65 63rd Ave
- 150-01 Horace Harding Expy
- 58-33 150th St
- 58-13 150th St
- 5804 Main St Unit 2D
- 58-04 Main St Unit 1A
- 149-03 Reeves Ave
- 150-29 59th Ave
- 150-40 60th Ave
- 150-42 60th Ave
- 150-30 Booth Memorial Ave
- 136-43 58th Rd
- 136-23 61st Rd
- 63-05 138th St
- 146-21 Horace Harding Expy
- 14617 Horace Harding Expy
- 14621 Horace Harding Expy
- 14615 Horace Harding Expy
- 14623 Horace Harding Expy
- 146-15 Horace Harding Expy
- 14623 Horace Harding Expy
- 14613 Horace Harding Expy
- 14625 Horace Harding Expy
- 146-13 Horace Harding Expy
- 14627 Horace Harding Expy
- 146-27 Horace Harding Expy
- 14611 Horace Harding Expy
- 14629 Horace Harding Expy
- 146-29 Horace Harding Expy
- 146-20 60th Ave Unit 1 FL
- 14618 60th Ave
- 14620 60th Ave
- 14616 60th Ave
- 14622 60th Ave