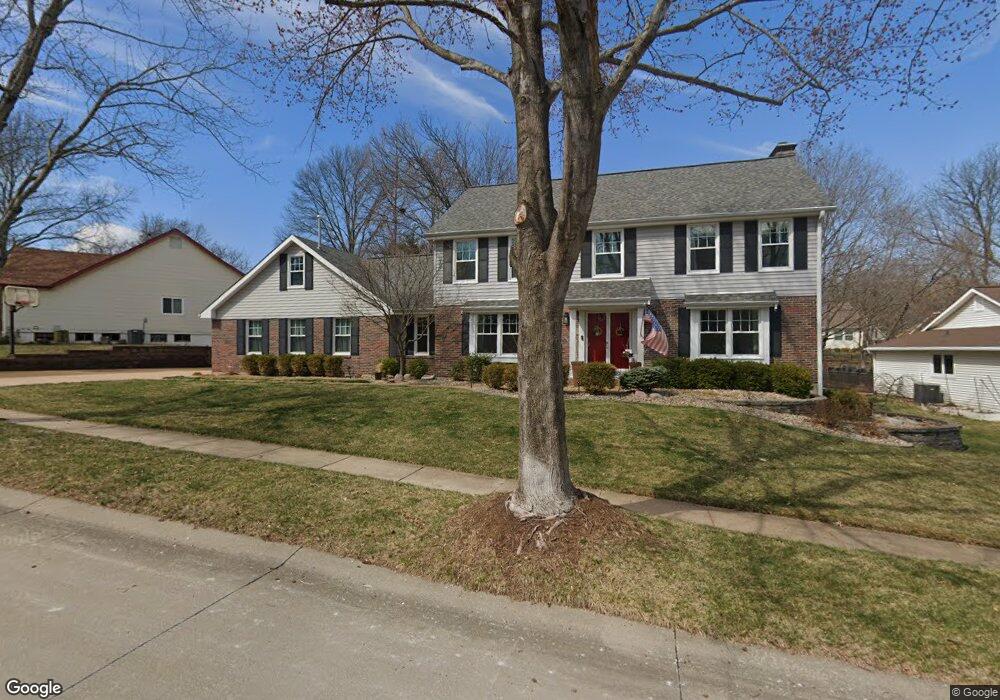
14621 Mill Spring Ct Chesterfield, MO 63017
Estimated Value: $584,000 - $773,000
4
Beds
3
Baths
2,752
Sq Ft
$242/Sq Ft
Est. Value
About This Home
This home is located at 14621 Mill Spring Ct, Chesterfield, MO 63017 and is currently estimated at $665,404, approximately $241 per square foot. 14621 Mill Spring Ct is a home located in St. Louis County with nearby schools including Shenandoah Valley Elementary, Parkway Central Middle School, and Parkway Central High School.
Ownership History
Date
Name
Owned For
Owner Type
Purchase Details
Closed on
Nov 1, 2012
Sold by
Savage John H and Savage Lori
Bought by
Iverson Scott A and Iverson Jennifer L
Current Estimated Value
Home Financials for this Owner
Home Financials are based on the most recent Mortgage that was taken out on this home.
Original Mortgage
$278,000
Outstanding Balance
$193,281
Interest Rate
3.52%
Mortgage Type
New Conventional
Estimated Equity
$472,123
Purchase Details
Closed on
Dec 17, 2010
Sold by
Hand Jason A and Hand Sarah
Bought by
Savage John H and Savage Lori
Home Financials for this Owner
Home Financials are based on the most recent Mortgage that was taken out on this home.
Original Mortgage
$326,600
Interest Rate
4.24%
Mortgage Type
New Conventional
Purchase Details
Closed on
Jul 29, 1998
Sold by
Howk Patrck J and Howk Pamela M
Bought by
Peterson John R and Peterson Lisa
Home Financials for this Owner
Home Financials are based on the most recent Mortgage that was taken out on this home.
Original Mortgage
$204,000
Interest Rate
6.94%
Create a Home Valuation Report for This Property
The Home Valuation Report is an in-depth analysis detailing your home's value as well as a comparison with similar homes in the area
Home Values in the Area
Average Home Value in this Area
Purchase History
| Date | Buyer | Sale Price | Title Company |
|---|---|---|---|
| Iverson Scott A | $347,500 | Investors Title Co Clayton | |
| Savage John H | $355,000 | None Available | |
| Peterson John R | -- | -- |
Source: Public Records
Mortgage History
| Date | Status | Borrower | Loan Amount |
|---|---|---|---|
| Open | Iverson Scott A | $278,000 | |
| Previous Owner | Savage John H | $326,600 | |
| Previous Owner | Peterson John R | $204,000 |
Source: Public Records
Tax History
| Year | Tax Paid | Tax Assessment Tax Assessment Total Assessment is a certain percentage of the fair market value that is determined by local assessors to be the total taxable value of land and additions on the property. | Land | Improvement |
|---|---|---|---|---|
| 2025 | $5,930 | $103,610 | $39,200 | $64,410 |
| 2024 | $5,930 | $89,700 | $23,520 | $66,180 |
| 2023 | $5,688 | $89,700 | $23,520 | $66,180 |
| 2022 | $5,614 | $80,580 | $23,520 | $57,060 |
| 2021 | $5,591 | $80,580 | $23,520 | $57,060 |
| 2020 | $5,628 | $77,900 | $23,140 | $54,760 |
| 2019 | $5,505 | $77,900 | $23,140 | $54,760 |
| 2018 | $5,529 | $72,560 | $23,140 | $49,420 |
| 2017 | $5,378 | $72,560 | $23,140 | $49,420 |
| 2016 | $5,254 | $67,360 | $17,100 | $50,260 |
Source: Public Records
Map
Nearby Homes
- 1505 Timberbluff Ct
- 1620 Chalmers Dr
- 1801 Summer Blossom Place
- 14543 Debbenham Ln
- 14569 Crossway Ct
- 2317 Hank's Close Unit 186 STB
- 14342 Manderleigh Woods Dr
- 14304 Willow Spring Hill Dr
- 731 Kraffel Ln
- 14260 Cedar Springs Dr
- 1529 Woodroyal East Dr
- 2042 Kentmore Ln Unit F30
- 2052 Tramore Ct Unit 34D
- 3 Willow at Woods Mill Crossing
- 2 Willow at Woods Mill Crossing
- 14316 E Conway Meadows Ct Unit 202
- 14305 Woods Mill Crossing Unit 101
- 14305 Woods Mill Crossing Unit 202
- 14305 Woods Mill Crossing Unit 102
- 14305 Woods Mill Crossing Unit 402
- 14645 Mill Spring Ct
- 14613 Mill Spring Ct
- 14640 Big Timber Ln
- 14634 Big Timber Ln
- 14659 Mill Spring Ct
- 14620 Mill Spring Ct
- 14628 Mill Spring Ct
- 14612 Mill Spring Ct
- 14636 Mill Spring Ct
- 14603 Mill Spring Ct
- 14636 Mill Spring Ct
- 14604 Mill Spring Ct
- 14652 Mill Spring Ct
- 14644 Mill Spring Ct
- 14635 Big Timber Ln
- 14641 Big Timber Ln
- 14660 Mill Spring Ct
- 14622 Big Timber Ln
- 14703 Mill Spring Dr
- 14617 Oak Orchard Ct
Your Personal Tour Guide
Ask me questions while you tour the home.