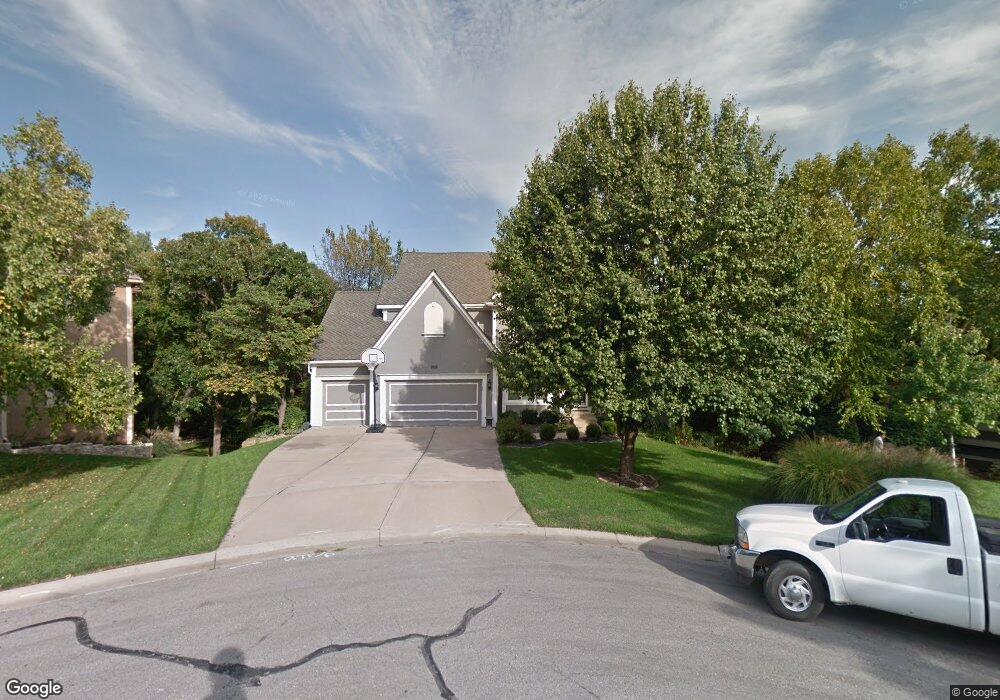
14621 W 49th Terrace Shawnee, KS 66216
Estimated Value: $656,000 - $684,000
4
Beds
5
Baths
3,306
Sq Ft
$202/Sq Ft
Est. Value
About This Home
This home is located at 14621 W 49th Terrace, Shawnee, KS 66216 and is currently estimated at $667,209, approximately $201 per square foot. 14621 W 49th Terrace is a home located in Johnson County with nearby schools including Ray Marsh Elementary School, Trailridge Middle School, and Shawnee Mission Northwest High School.
Ownership History
Date
Name
Owned For
Owner Type
Purchase Details
Closed on
Jul 12, 2011
Sold by
Swarts Jon D and Mcroy Sheilah E
Bought by
Swarts Jon D and Mcroy Sheilah E
Current Estimated Value
Home Financials for this Owner
Home Financials are based on the most recent Mortgage that was taken out on this home.
Original Mortgage
$304,000
Outstanding Balance
$209,537
Interest Rate
4.55%
Mortgage Type
New Conventional
Estimated Equity
$457,672
Purchase Details
Closed on
Aug 31, 2004
Sold by
Trullinger Daniel R and Trullinger Theresa L
Bought by
Dean Jon D and Mcroy Sheilah E
Home Financials for this Owner
Home Financials are based on the most recent Mortgage that was taken out on this home.
Original Mortgage
$328,000
Interest Rate
6.08%
Mortgage Type
New Conventional
Create a Home Valuation Report for This Property
The Home Valuation Report is an in-depth analysis detailing your home's value as well as a comparison with similar homes in the area
Home Values in the Area
Average Home Value in this Area
Purchase History
| Date | Buyer | Sale Price | Title Company |
|---|---|---|---|
| Swarts Jon D | -- | All American Title Company | |
| Dean Jon D | -- | Chicago Title Insurance Comp |
Source: Public Records
Mortgage History
| Date | Status | Borrower | Loan Amount |
|---|---|---|---|
| Open | Swarts Jon D | $304,000 | |
| Closed | Dean Jon D | $328,000 | |
| Closed | Dean Jon D | $61,500 |
Source: Public Records
Tax History Compared to Growth
Tax History
| Year | Tax Paid | Tax Assessment Tax Assessment Total Assessment is a certain percentage of the fair market value that is determined by local assessors to be the total taxable value of land and additions on the property. | Land | Improvement |
|---|---|---|---|---|
| 2024 | $6,928 | $64,883 | $12,917 | $51,966 |
| 2023 | $6,563 | $61,076 | $11,225 | $49,851 |
| 2022 | $6,077 | $56,373 | $11,225 | $45,148 |
| 2021 | $6,077 | $53,533 | $10,202 | $43,331 |
| 2020 | $6,073 | $52,429 | $10,202 | $42,227 |
| 2019 | $5,674 | $48,944 | $9,268 | $39,676 |
| 2018 | $5,507 | $47,323 | $9,268 | $38,055 |
| 2017 | $5,843 | $49,450 | $8,421 | $41,029 |
| 2016 | $6,377 | $53,314 | $8,017 | $45,297 |
| 2015 | $5,941 | $51,233 | $8,017 | $43,216 |
| 2013 | -- | $47,610 | $8,017 | $39,593 |
Source: Public Records
Map
Nearby Homes
- 4940 Alden St
- 14210 W 50th St
- 14105 W 48th Terrace
- 13810 W 53rd St
- 5502 Mullen Rd
- 5300 Summit Ct
- 13804 W 55th Terrace
- 180 Terrace Trail S
- 5633 Oakview St
- 5530 Rene St
- 5021 Bradshaw St
- 5013 Bradshaw St
- 5713 Widmer Rd
- 5507 Noland Rd
- 5703 Cottonwood St
- 14170 W 49th St
- 13305 W 51st St
- 5826 Oakview St
- 132 Lakeshore Dr W
- 110 Terrace Trail St W
- 14626 W 49th Terrace
- 14608 W 49th Terrace
- 14625 W 49th Terrace
- 14609 W 49th Terrace
- 14611 W 49th St
- 14630 W 49th Terrace
- 14629 W 49th Terrace
- 14604 W 49th Terrace
- 14620 W 50th St
- 14624 W 50th St
- 14616 W 50th St
- 4933 Alden St
- 4945 Alden St
- 14605 W 49th Terrace
- 14628 W 50th St
- 14607 W 49th St
- 14612 W 50th St
- 14615 W 49th St
- 4949 Alden St
- 4925 Alden St