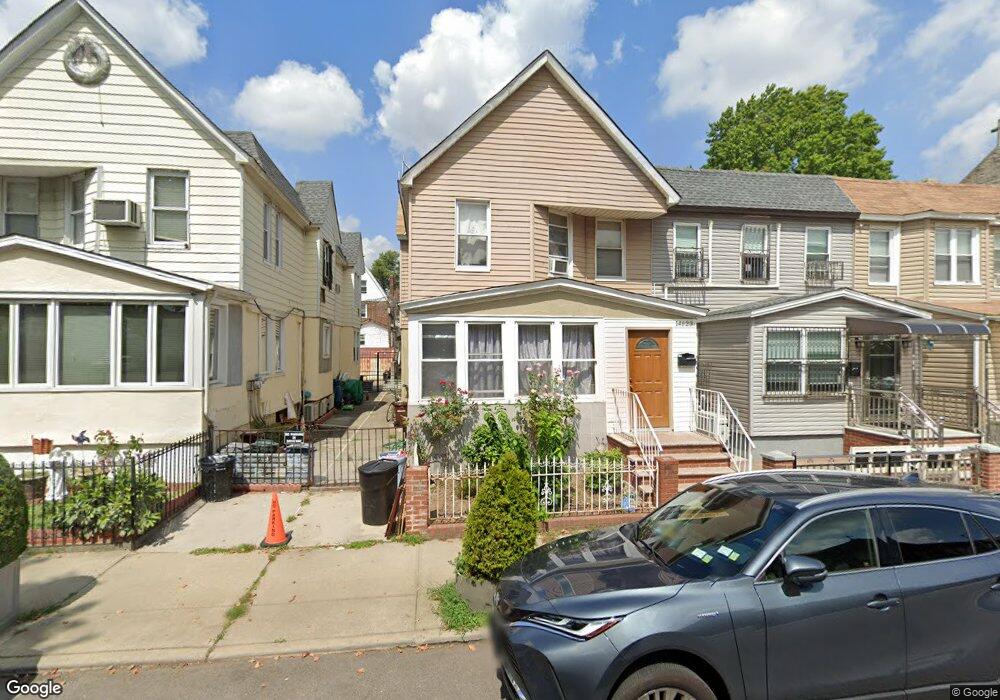
14623 Jasmine Ave Flushing, NY 11355
Flushing NeighborhoodEstimated Value: $1,325,702 - $1,481,000
7
Beds
4
Baths
2,160
Sq Ft
$652/Sq Ft
Est. Value
About This Home
This home is located at 14623 Jasmine Ave, Flushing, NY 11355 and is currently estimated at $1,408,676, approximately $652 per square foot. 14623 Jasmine Ave is a home located in Queens County with nearby schools including P.S. 024 Andrew Jackson School, Rachel Carson I.S. 237Q, and Francis Lewis High School.
Ownership History
Date
Name
Owned For
Owner Type
Purchase Details
Closed on
Feb 28, 2025
Sold by
Chen Xiu Ping and Liu Ying
Bought by
Chen Xiangfeng and Li Meng Jun
Current Estimated Value
Purchase Details
Closed on
Jul 5, 2007
Sold by
Castro Naida and Castro Oscar
Bought by
Chen Xiu Ping and Liu Ying
Home Financials for this Owner
Home Financials are based on the most recent Mortgage that was taken out on this home.
Original Mortgage
$100,000
Outstanding Balance
$61,451
Interest Rate
6.54%
Estimated Equity
$1,347,225
Purchase Details
Closed on
Jun 9, 2000
Sold by
Kozar Eugenio and Kozar Zoila
Bought by
Castro Oscar and Castro Naida
Home Financials for this Owner
Home Financials are based on the most recent Mortgage that was taken out on this home.
Original Mortgage
$284,050
Interest Rate
8.59%
Create a Home Valuation Report for This Property
The Home Valuation Report is an in-depth analysis detailing your home's value as well as a comparison with similar homes in the area
Home Values in the Area
Average Home Value in this Area
Purchase History
| Date | Buyer | Sale Price | Title Company |
|---|---|---|---|
| Chen Xiangfeng | -- | -- | |
| Chen Xiu Ping | $675,000 | -- | |
| Chen Xiu Ping | $675,000 | -- | |
| Castro Oscar | $299,000 | Fidelity National Title Ins | |
| Castro Oscar | $299,000 | Fidelity National Title Ins |
Source: Public Records
Mortgage History
| Date | Status | Borrower | Loan Amount |
|---|---|---|---|
| Open | Chen Xiu Ping | $100,000 | |
| Closed | Chen Xiu Ping | $100,000 | |
| Open | Chen Xiu Ping | $499,000 | |
| Closed | Chen Xiu Ping | $499,000 | |
| Previous Owner | Castro Oscar | $284,050 |
Source: Public Records
Tax History
| Year | Tax Paid | Tax Assessment Tax Assessment Total Assessment is a certain percentage of the fair market value that is determined by local assessors to be the total taxable value of land and additions on the property. | Land | Improvement |
|---|---|---|---|---|
| 2025 | $8,535 | $44,588 | $11,269 | $33,319 |
| 2024 | $8,535 | $42,492 | $10,841 | $31,651 |
| 2023 | $8,052 | $40,090 | $10,164 | $29,926 |
| 2022 | $7,550 | $80,280 | $19,380 | $60,900 |
| 2021 | $7,960 | $70,380 | $19,380 | $51,000 |
| 2020 | $7,865 | $71,820 | $19,380 | $52,440 |
| 2019 | $7,407 | $71,760 | $19,380 | $52,380 |
| 2018 | $6,810 | $33,408 | $12,816 | $20,592 |
| 2017 | $6,425 | $31,518 | $11,065 | $20,453 |
| 2016 | $6,301 | $31,518 | $11,065 | $20,453 |
| 2015 | $3,586 | $30,964 | $16,766 | $14,198 |
| 2014 | $3,586 | $29,509 | $13,582 | $15,927 |
Source: Public Records
Map
Nearby Homes
- 146-23 Laburnum Ave
- 148-10 Kalmia Ave
- 148-11 Kalmia Ave
- 146-18 Laburnum Ave
- 14824 Kalmia Ave
- 148-24 Kalmia Ave
- 43-45 Burling St
- 148-29 Laburnum Ave
- 143-16 Holly Ave
- 45-24 Burling St
- 45-30 Smart St
- 46-43 157th St
- 157-18 Laburnum Ave
- 149-27 45th Ave
- 46-05 158th St
- 45-20 156th St
- 142-03 45th Ave
- 4341 Burling St
- 52-06 Bowne St
- 46-40 Kissena Blvd
- 14625 Jasmine Ave
- 14619 Jasmine Ave
- 146-25 Jasmine Ave
- 14627 Jasmine Ave
- 14617 Jasmine Ave
- 14617 Jasmine Ave
- 14617 Jasmine Ave
- 14629 Jasmine Ave
- 14615 Jasmine Ave
- 14631 Jasmine Ave
- 14613 Jasmine Ave
- 14613 Jasmine Ave
- 14624 Holly Ave
- 14633 Jasmine Ave
- 14622 Holly Ave
- 146-33 Jasmine Ave
- 146-28 Holly Ave
- 14628 Holly Ave
- 14611 Jasmine Ave
- 146-11 Jasmine Ave