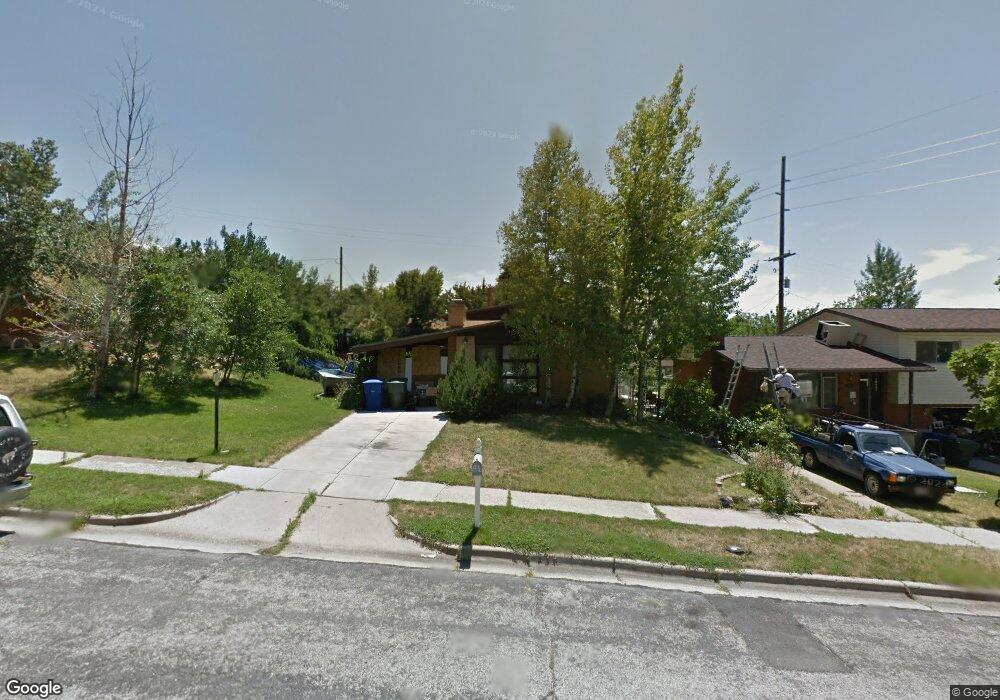
1463 3rd St Ogden, UT 84404
Horace Mann NeighborhoodEstimated Value: $388,000 - $402,000
4
Beds
3
Baths
1,744
Sq Ft
$228/Sq Ft
Est. Value
About This Home
This home is located at 1463 3rd St, Ogden, UT 84404 and is currently estimated at $397,732, approximately $228 per square foot. 1463 3rd St is a home located in Weber County with nearby schools including Mound Fort Junior High School and Ben Lomond High School.
Ownership History
Date
Name
Owned For
Owner Type
Purchase Details
Closed on
Aug 11, 2005
Sold by
Turnblom Kevin W
Bought by
Turnblom Kevin W and Turnblom Melissa
Current Estimated Value
Home Financials for this Owner
Home Financials are based on the most recent Mortgage that was taken out on this home.
Original Mortgage
$125,644
Outstanding Balance
$65,237
Interest Rate
5.48%
Mortgage Type
VA
Estimated Equity
$332,495
Purchase Details
Closed on
Jul 30, 2003
Sold by
Myers Ora
Bought by
Myers Ora Sue
Home Financials for this Owner
Home Financials are based on the most recent Mortgage that was taken out on this home.
Original Mortgage
$92,000
Interest Rate
4.55%
Mortgage Type
Purchase Money Mortgage
Purchase Details
Closed on
Apr 21, 1999
Sold by
Hardy Ora Sue
Bought by
Myers Ora
Purchase Details
Closed on
Jan 10, 1996
Sold by
Sheffield Karen and Sullivan Karen
Bought by
Hardy Ora Sue
Home Financials for this Owner
Home Financials are based on the most recent Mortgage that was taken out on this home.
Original Mortgage
$98,500
Interest Rate
7.38%
Create a Home Valuation Report for This Property
The Home Valuation Report is an in-depth analysis detailing your home's value as well as a comparison with similar homes in the area
Home Values in the Area
Average Home Value in this Area
Purchase History
| Date | Buyer | Sale Price | Title Company |
|---|---|---|---|
| Turnblom Kevin W | -- | First American Title | |
| Turnblom Kevin W | -- | First American Title | |
| Myers Ora Sue | -- | Inwest Title | |
| Myers Ora | -- | -- | |
| Hardy Ora Sue | -- | First American Title |
Source: Public Records
Mortgage History
| Date | Status | Borrower | Loan Amount |
|---|---|---|---|
| Open | Turnblom Kevin W | $125,644 | |
| Previous Owner | Myers Ora Sue | $92,000 | |
| Previous Owner | Hardy Ora Sue | $98,500 |
Source: Public Records
Tax History
| Year | Tax Paid | Tax Assessment Tax Assessment Total Assessment is a certain percentage of the fair market value that is determined by local assessors to be the total taxable value of land and additions on the property. | Land | Improvement |
|---|---|---|---|---|
| 2025 | $2,807 | $376,368 | $114,013 | $262,355 |
| 2024 | $2,654 | $352,000 | $114,018 | $237,982 |
| 2023 | $2,723 | $367,000 | $106,298 | $260,702 |
| 2022 | $2,866 | $391,000 | $91,614 | $299,386 |
| 2021 | $2,169 | $265,000 | $56,945 | $208,055 |
| 2020 | $2,053 | $231,000 | $42,470 | $188,530 |
| 2019 | $1,985 | $209,000 | $37,536 | $171,464 |
| 2018 | $1,775 | $184,000 | $32,558 | $151,442 |
| 2017 | $1,540 | $147,000 | $30,544 | $116,456 |
| 2016 | $1,522 | $78,627 | $14,274 | $64,353 |
| 2015 | $1,273 | $63,657 | $14,274 | $49,383 |
| 2014 | $1,219 | $59,878 | $14,274 | $45,604 |
Source: Public Records
Map
Nearby Homes
- 1453 Lewis Dr
- 3270 N 3325 W Unit 386B
- 1363 Lewis Dr
- 3091 N 3075 W
- 1582 E Maddies Cove Unit 19
- 1274 5th St
- 1568 Hudson St Unit 1
- 322 Harrison Blvd
- 1243 Hudson St
- 572 S Elena Ln
- 1090 Harrop St
- 1565 E 775 S Unit 7
- 186 N Harrison Blvd Unit 1
- 1062 Hudson St
- 142 S Eccles Ave
- 1010 1st St
- 1149 Dan St
- 580 Marco Ln
- 983 Rancho Blvd Unit 3
- 357 Monroe Blvd Unit 5
Your Personal Tour Guide
Ask me questions while you tour the home.