1463 Furnace Rd Lincolnton, NC 28092
Estimated Value: $106,000 - $198,000
3
Beds
2
Baths
1,755
Sq Ft
$87/Sq Ft
Est. Value
About This Home
This home is located at 1463 Furnace Rd, Lincolnton, NC 28092 and is currently estimated at $152,000, approximately $86 per square foot. 1463 Furnace Rd is a home located in Lincoln County with nearby schools including Iron Station Elementary School, North Lincoln Middle School, and North Lincoln High School.
Ownership History
Date
Name
Owned For
Owner Type
Purchase Details
Closed on
Apr 23, 2019
Sold by
Reel Shuford Charles and Reel Shuford Gloria
Bought by
Burgess Jamie Leann
Current Estimated Value
Home Financials for this Owner
Home Financials are based on the most recent Mortgage that was taken out on this home.
Original Mortgage
$62,448
Outstanding Balance
$54,903
Interest Rate
4.3%
Mortgage Type
FHA
Estimated Equity
$97,097
Purchase Details
Closed on
Sep 22, 2014
Sold by
Vanderbilt Mortgage And Finance Inc
Bought by
Shuford Charles and Shuford Gloria Reel
Purchase Details
Closed on
Sep 30, 2013
Sold by
Jenkins Cynthia Lea
Bought by
Vanderbilt Mortgage And Finance Inc
Purchase Details
Closed on
May 6, 2010
Sold by
Lindsay Cynthia Gayle Jenkins and Lindsay Brian Todd
Bought by
Vintin Jon M
Create a Home Valuation Report for This Property
The Home Valuation Report is an in-depth analysis detailing your home's value as well as a comparison with similar homes in the area
Home Values in the Area
Average Home Value in this Area
Purchase History
| Date | Buyer | Sale Price | Title Company |
|---|---|---|---|
| Burgess Jamie Leann | $64,000 | None Available | |
| Shuford Charles | $35,000 | None Available | |
| Vanderbilt Mortgage And Finance Inc | $62,100 | None Available | |
| Vintin Jon M | $84,000 | None Available |
Source: Public Records
Mortgage History
| Date | Status | Borrower | Loan Amount |
|---|---|---|---|
| Open | Burgess Jamie Leann | $62,448 |
Source: Public Records
Tax History Compared to Growth
Tax History
| Year | Tax Paid | Tax Assessment Tax Assessment Total Assessment is a certain percentage of the fair market value that is determined by local assessors to be the total taxable value of land and additions on the property. | Land | Improvement |
|---|---|---|---|---|
| 2025 | $618 | $77,814 | $38,040 | $39,774 |
| 2024 | $592 | $77,814 | $38,040 | $39,774 |
| 2023 | $585 | $77,814 | $38,040 | $39,774 |
| 2022 | $491 | $50,934 | $28,391 | $22,543 |
| 2021 | $491 | $50,934 | $28,391 | $22,543 |
| 2020 | $366 | $50,934 | $28,391 | $22,543 |
| 2019 | $355 | $50,934 | $28,391 | $22,543 |
| 2018 | $468 | $51,832 | $26,949 | $24,883 |
| 2017 | $367 | $51,832 | $26,949 | $24,883 |
| 2016 | $367 | $51,832 | $26,949 | $24,883 |
| 2015 | $446 | $51,832 | $26,949 | $24,883 |
| 2014 | $677 | $85,815 | $27,756 | $58,059 |
Source: Public Records
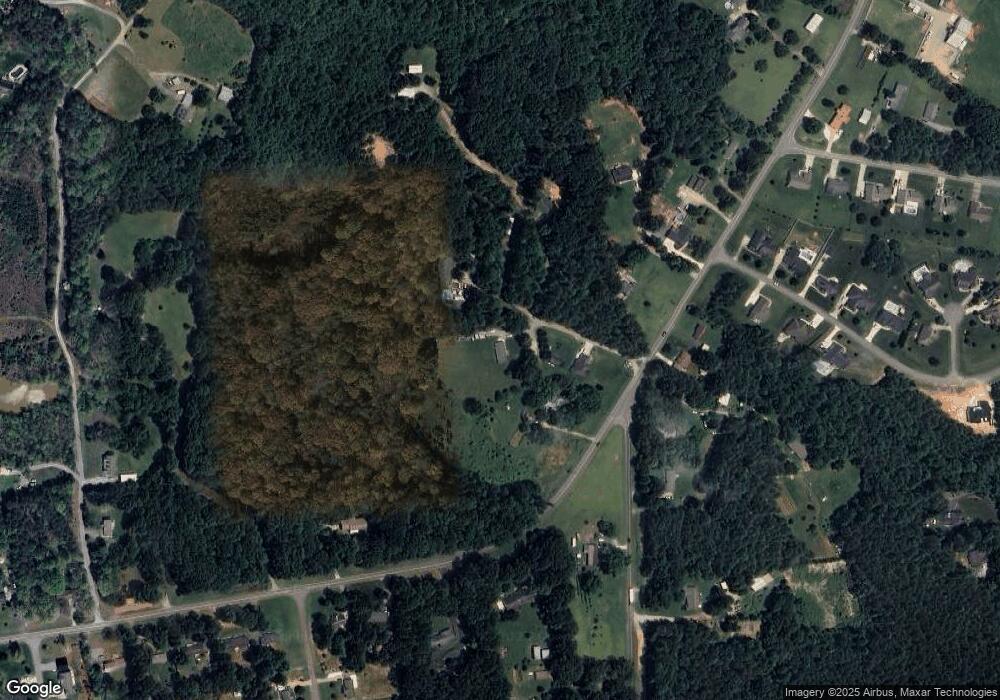
Map
Nearby Homes
- 1711 Furnace Road Extension
- 4059 Stoney Creek Dr
- 1850 Furnace Rd
- 1076 Furnace Rd
- 0 Mineral Ln
- 32 Miners Creek Dr
- 4465 Brancer Ln
- 4417 King Wilkinson Rd
- 5045 Amity Ln Unit 12
- 0 King Wilkinson Rd Unit 2 CAR4241102
- 812 Trinity Ln
- 5093 N Nc 150
- 1448 Weatherwood Dr
- lot 22 Weatherwood Dr
- 5345 Christopher Rd
- 4931 King Wilkinson Rd
- 3249 Ivey Creek Rd
- 2914 Weatherfield Dr
- 5406 Christopher Rd
- 2911 Weatherfield Dr
- 4889 Asbury Church Rd
- 1455 Furnace Rd
- 1475 Furnace Rd
- 1469 Furnace Rd
- 1434 Furnace Rd
- 1466 Furnace Rd
- 1474 Furnace Rd
- 4797 Asbury Church Rd
- 1483 Furnace Road Extension
- 1418 Furnace Rd
- 1397 Furnace Rd
- 1505 Furnace Road Extension
- 4838 Asbury Church Rd
- 4240 Woodsbury Ln
- 1519 Furnace Road Extension
- 1519 Furnace Road Extension
- Lot 37 Woodsbury Ln
- Lot 39 Woodsbury Ln
- Lot 21 Woodsbury Ln
- Lot 15 Woodsbury Ln