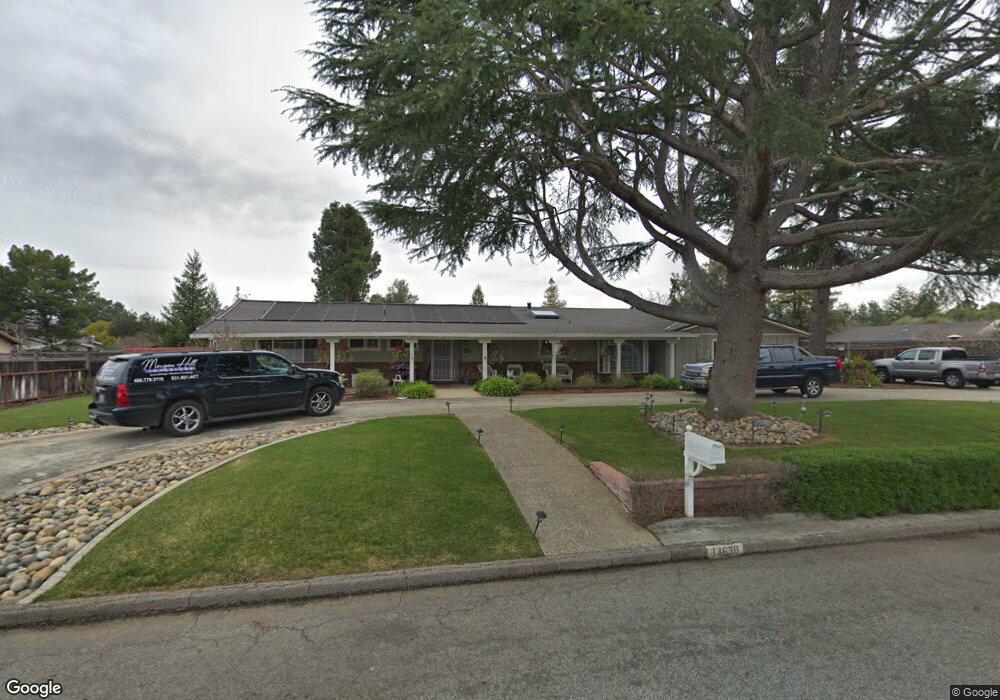
14630 Badger Pass Rd Morgan Hill, CA 95037
Estimated Value: $1,690,000 - $1,929,000
3
Beds
3
Baths
2,376
Sq Ft
$752/Sq Ft
Est. Value
About This Home
This home is located at 14630 Badger Pass Rd, Morgan Hill, CA 95037 and is currently estimated at $1,787,589, approximately $752 per square foot. 14630 Badger Pass Rd is a home located in Santa Clara County with nearby schools including San Martin/Gwinn Environmental Science Academy, Britton Middle School, and Ann Sobrato High School.
Ownership History
Date
Name
Owned For
Owner Type
Purchase Details
Closed on
Mar 28, 2002
Sold by
Snapp David Troy and Snapp Janet Carol
Bought by
Robertson James A and Robertson Melanie J
Current Estimated Value
Home Financials for this Owner
Home Financials are based on the most recent Mortgage that was taken out on this home.
Original Mortgage
$480,000
Outstanding Balance
$199,408
Interest Rate
6.84%
Mortgage Type
Purchase Money Mortgage
Estimated Equity
$1,588,181
Purchase Details
Closed on
Sep 21, 2000
Sold by
Snapp Daniel T
Bought by
Snapp David Troy and Snapp Janet Carol
Purchase Details
Closed on
Nov 25, 1996
Sold by
Snapp Janet C
Bought by
Snapp Janet C and Snapp David T
Home Financials for this Owner
Home Financials are based on the most recent Mortgage that was taken out on this home.
Original Mortgage
$218,500
Interest Rate
8.25%
Mortgage Type
Purchase Money Mortgage
Create a Home Valuation Report for This Property
The Home Valuation Report is an in-depth analysis detailing your home's value as well as a comparison with similar homes in the area
Home Values in the Area
Average Home Value in this Area
Purchase History
| Date | Buyer | Sale Price | Title Company |
|---|---|---|---|
| Robertson James A | $600,000 | Alliance Title Company | |
| Snapp David Troy | -- | Financial Title Company | |
| Snapp Janet C | $146,000 | Golden California Title |
Source: Public Records
Mortgage History
| Date | Status | Borrower | Loan Amount |
|---|---|---|---|
| Open | Robertson James A | $480,000 | |
| Previous Owner | Snapp Janet C | $218,500 |
Source: Public Records
Tax History Compared to Growth
Tax History
| Year | Tax Paid | Tax Assessment Tax Assessment Total Assessment is a certain percentage of the fair market value that is determined by local assessors to be the total taxable value of land and additions on the property. | Land | Improvement |
|---|---|---|---|---|
| 2025 | $10,705 | $1,238,876 | $531,522 | $707,354 |
| 2024 | $10,705 | $931,006 | $521,100 | $409,906 |
| 2023 | $10,568 | $912,752 | $510,883 | $401,869 |
| 2022 | $10,391 | $894,856 | $500,866 | $393,990 |
| 2021 | $10,131 | $877,311 | $491,046 | $386,265 |
| 2020 | $9,887 | $868,316 | $486,011 | $382,305 |
| 2019 | $10,167 | $851,291 | $476,482 | $374,809 |
| 2018 | $10,199 | $834,600 | $467,140 | $367,460 |
| 2017 | $10,104 | $818,236 | $457,981 | $360,255 |
| 2016 | $9,464 | $802,193 | $449,001 | $353,192 |
| 2015 | $9,363 | $790,144 | $442,257 | $347,887 |
| 2014 | $9,502 | $774,667 | $433,594 | $341,073 |
Source: Public Records
Map
Nearby Homes
- 42 Dewey Cir
- 56 Creekside Dr Unit 56
- 92 Melody Ln Unit 92
- 97 Melody Ln Unit 97
- 14515 Shadowlane Ct
- 136 Vinewood Ln Unit 136
- 1020 Brookview Ct
- 199 Leisure Dr Unit 199
- 14668 Excaliber Ct
- 15120 Venetian Way
- 15180 Venetian Way
- 542 Via Sorrento
- 15145 Bellini Way
- 507 Via Sorrento
- 1935 Hayes Ln
- 14325 Monterey Rd
- 14430 Monterey Hwy
- 605 Encino Dr
- 0 Seymour Ave Unit 225017465
- 140 La Crosse Dr
- 14638 Badger Pass Rd
- 14637 Badger Pass Rd
- 14620 Badger Pass Rd
- 14639 Badger Pass Rd
- 14625 Badger Pass Rd
- 14616 Badger Pass Rd
- 14675 Gallant Fox Way
- 14665 Gallant Fox Way
- 14685 Gallant Fox Way
- 14645 Badger Pass Rd
- 14645 Gallant Fox Way
- 14627 Badger Pass Rd
- 14690 Badger Pass Rd
- 14611 Badger Pass Rd
- 14606 Badger Pass Rd
- 24 Chestnut Ct Unit 24
- 20 Chestnut Ct Unit 20
- 28 Chestnut Ct Unit 28
- 22 Chestnut Ct Unit 22
- 19 Chestnut Ct Unit 19