14630 Beloit Snodes Rd Beloit, OH 44609
Estimated Value: $164,000 - $438,000
3
Beds
1
Bath
1,373
Sq Ft
$206/Sq Ft
Est. Value
About This Home
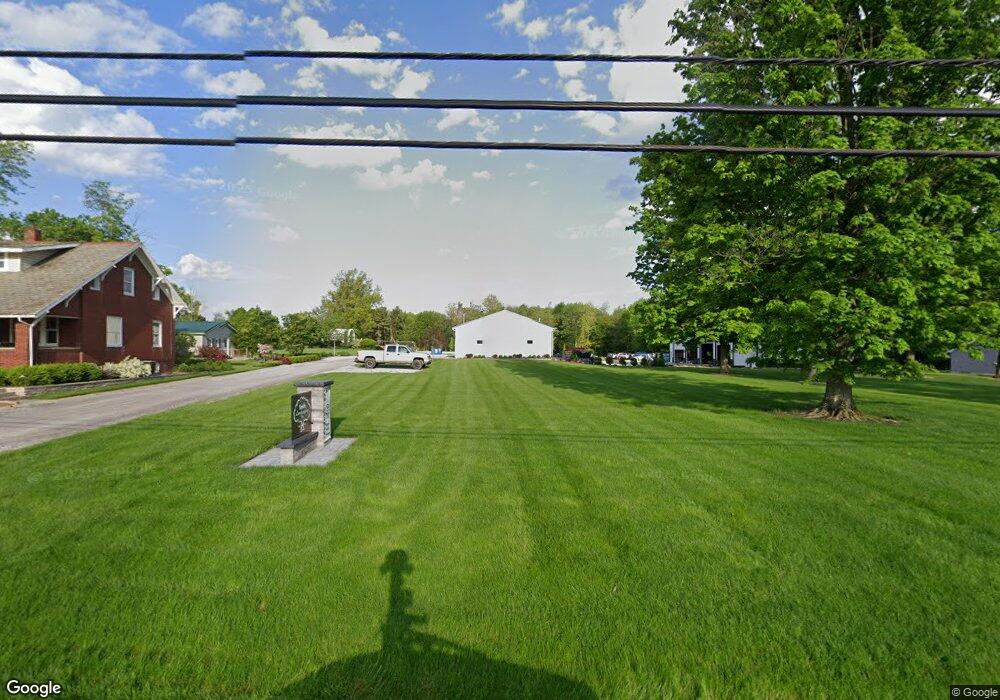
This home is located at 14630 Beloit Snodes Rd, Beloit, OH 44609 and is currently estimated at $282,231, approximately $205 per square foot. 14630 Beloit Snodes Rd is a home located in Mahoning County with nearby schools including West Branch Middle School, West Branch Early Learning Center, and West Branch High School.
Ownership History
Date
Name
Owned For
Owner Type
Purchase Details
Closed on
Sep 23, 2019
Sold by
Brown Robert W and Brown Anne C
Bought by
Smith Brian G and Smith Brad R
Current Estimated Value
Home Financials for this Owner
Home Financials are based on the most recent Mortgage that was taken out on this home.
Original Mortgage
$130,250
Outstanding Balance
$53,268
Interest Rate
3.6%
Mortgage Type
Future Advance Clause Open End Mortgage
Estimated Equity
$228,963
Purchase Details
Closed on
Jul 23, 2003
Sold by
Smith Robert G and Smith Norma L
Bought by
Smith Brian G and Smith Brad R
Home Financials for this Owner
Home Financials are based on the most recent Mortgage that was taken out on this home.
Original Mortgage
$115,500
Interest Rate
6%
Mortgage Type
Unknown
Purchase Details
Closed on
Oct 28, 1965
Bought by
Smith Robert G and Smith Norma L
Create a Home Valuation Report for This Property
The Home Valuation Report is an in-depth analysis detailing your home's value as well as a comparison with similar homes in the area
Purchase History
| Date | Buyer | Sale Price | Title Company |
|---|---|---|---|
| Smith Brian G | $63,300 | Heritage Union Title Co Ltd | |
| Smith Brian G | $116,000 | Heritage Title Agency | |
| Smith Robert G | -- | -- |
Source: Public Records
Mortgage History
| Date | Status | Borrower | Loan Amount |
|---|---|---|---|
| Open | Smith Brian G | $130,250 | |
| Previous Owner | Smith Brian G | $115,500 |
Source: Public Records
Tax History
| Year | Tax Paid | Tax Assessment Tax Assessment Total Assessment is a certain percentage of the fair market value that is determined by local assessors to be the total taxable value of land and additions on the property. | Land | Improvement |
|---|---|---|---|---|
| 2025 | $3,243 | $88,650 | $23,630 | $65,020 |
| 2024 | $3,243 | $88,650 | $23,630 | $65,020 |
| 2023 | $3,182 | $88,650 | $23,630 | $65,020 |
| 2022 | $1,896 | $47,580 | $18,880 | $28,700 |
| 2021 | $1,898 | $47,580 | $18,880 | $28,700 |
| 2020 | $1,905 | $47,580 | $18,880 | $28,700 |
| 2019 | $1,360 | $32,380 | $9,130 | $23,250 |
| 2018 | $1,354 | $32,380 | $9,130 | $23,250 |
| 2017 | $1,404 | $32,380 | $9,130 | $23,250 |
| 2016 | $1,457 | $35,100 | $10,530 | $24,570 |
| 2015 | $1,414 | $35,100 | $10,530 | $24,570 |
| 2014 | $1,421 | $35,100 | $10,530 | $24,570 |
| 2013 | $1,406 | $35,100 | $10,530 | $24,570 |
Source: Public Records
Map
Nearby Homes
- 18061 Derr Ave
- 27292 Lake Front Dr
- 26223 Wildwood Dr
- 35 Bayview Dr
- 18280 5th St
- 430 Hillsdale St
- 423 S 14th St
- 540 S 15th St
- 57 Redwood St
- 104 W Carolina Ave
- 324 S 15th St
- 208 S 15th St
- 195 E Pennsylvania Ave
- 14831 Smith Goshen Rd
- 345 E Indiana Ave
- 18262 W Pine Lake Rd
- 157 E Ohio Ave
- 175 W Ohio Ave
- 125 E Indiana Ave
- 495 W Texas Ave
- 14664 Beloit Snodes Rd
- 14641 Beloit Snodes Rd
- 14601 Beloit Snodes Rd
- 14560 Beloit Snodes Rd
- 14740 Beloit Snodes Rd
- 14575 Beloit Snodes Rd
- 14524 Beloit Snodes Rd
- 14535 Beloit Snodes Rd
- 14517 Beloit Snodes Rd
- 14497 Beloit Snodes Rd
- 14812 Beloit Snodes Rd
- 14830 Beloit Snodes Rd
- 14890 Beloit Snodes Rd
- 14358 Beloit Snodes Rd
- 14375 Beloit Snodes Rd
- 14924 Beloit Snodes Rd
- 14330 S Main St
- 14935 Beloit Snodes Rd
- 14949 Beloit Snodes Rd
- 14308 S Main St
Your Personal Tour Guide
Ask me questions while you tour the home.