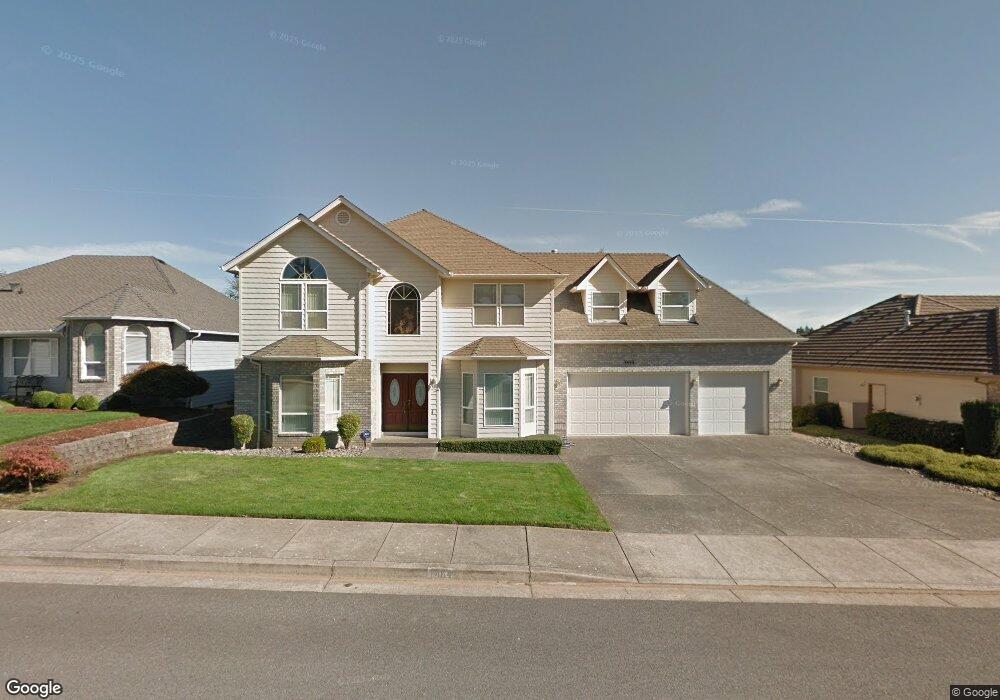
1464 Ranier Loop NW Salem, OR 97304
West Salem NeighborhoodEstimated Value: $649,919 - $727,000
4
Beds
3
Baths
2,994
Sq Ft
$230/Sq Ft
Est. Value
About This Home
This home is located at 1464 Ranier Loop NW, Salem, OR 97304 and is currently estimated at $687,480, approximately $229 per square foot. 1464 Ranier Loop NW is a home located in Polk County with nearby schools including Chapman Hill Elementary School, Straub Middle School, and West Salem High School.
Ownership History
Date
Name
Owned For
Owner Type
Purchase Details
Closed on
Mar 31, 2023
Sold by
Kumar Thuy
Bought by
Kumar Family Trust
Current Estimated Value
Purchase Details
Closed on
Nov 2, 2022
Sold by
Kumar Thuy
Bought by
Kumar Thuy
Purchase Details
Closed on
Oct 25, 2021
Sold by
Kumar Thuy and Nguyen Quynh Thi
Bought by
Kumar Thuy and Nguyen Quynh Thi
Home Financials for this Owner
Home Financials are based on the most recent Mortgage that was taken out on this home.
Original Mortgage
$379,350
Interest Rate
2.8%
Mortgage Type
New Conventional
Purchase Details
Closed on
Dec 29, 2004
Sold by
Nguyen Thuy Ngoc
Bought by
Nguyen Quynh Thi Ngoc and Nguyen Thuy Ngoc
Purchase Details
Closed on
Sep 7, 2004
Sold by
Nguyen Quynh T and Nguyen Hung Q
Bought by
Nguyen Thuy Ngoc
Home Financials for this Owner
Home Financials are based on the most recent Mortgage that was taken out on this home.
Original Mortgage
$270,000
Interest Rate
6.06%
Mortgage Type
Stand Alone First
Create a Home Valuation Report for This Property
The Home Valuation Report is an in-depth analysis detailing your home's value as well as a comparison with similar homes in the area
Home Values in the Area
Average Home Value in this Area
Purchase History
| Date | Buyer | Sale Price | Title Company |
|---|---|---|---|
| Kumar Family Trust | -- | None Listed On Document | |
| Kumar Thuy | -- | -- | |
| Kumar Thuy | -- | First American | |
| Nguyen Quynh Thi Ngoc | $360,000 | Amerititle | |
| Nguyen Thuy Ngoc | $360,000 | Amerititle |
Source: Public Records
Mortgage History
| Date | Status | Borrower | Loan Amount |
|---|---|---|---|
| Previous Owner | Kumar Thuy | $379,350 | |
| Previous Owner | Nguyen Thuy Ngoc | $270,000 | |
| Closed | Nguyen Thuy Ngoc | $54,000 |
Source: Public Records
Tax History
| Year | Tax Paid | Tax Assessment Tax Assessment Total Assessment is a certain percentage of the fair market value that is determined by local assessors to be the total taxable value of land and additions on the property. | Land | Improvement |
|---|---|---|---|---|
| 2025 | $7,572 | $413,830 | $70,480 | $343,350 |
| 2024 | $7,572 | $401,780 | $68,430 | $333,350 |
| 2023 | $7,352 | $390,080 | $66,440 | $323,640 |
| 2022 | $7,116 | $378,720 | $64,500 | $314,220 |
| 2021 | $6,913 | $367,690 | $62,620 | $305,070 |
| 2020 | $6,708 | $356,990 | $60,790 | $296,200 |
| 2019 | $6,474 | $346,600 | $59,020 | $287,580 |
| 2018 | $6,367 | $336,510 | $57,300 | $279,210 |
| 2017 | $5,738 | $326,710 | $55,630 | $271,080 |
| 2016 | $5,601 | $317,200 | $54,010 | $263,190 |
Source: Public Records
Map
Nearby Homes
- 1321 Chapman Hill Dr NW
- 1654 Pelican Ct NW
- 1655 Diamond Peak Ct NW
- 1534 Gearhart Ave NW
- 1656 Ashland Ct NW
- 1380 Ranier Loop NW
- 1637 Ptarmigan St NW
- 1674 Olympia Ct NW
- 1680 Snowbird Ct NW
- 1401 Ranier Loop NW
- 1660 Snowbird Ct NW
- 1317 Parkway Dr NW
- 1247 Lottie Ln NW
- 1587 Westhaven Ave NW
- 1450 Willie Way NW
- 1782 Sunburst Terrace NW
- 1936 Orchard Heights Rd NW
- 1283 Karen Way NW Unit 73
- 1050 Cardinal St NW
- 1242 Goldcrest Ave NW
- 1470 Ranier Loop NW
- 1460 Ranier Loop NW
- 1625 Sisters Ct NW
- 1645 Sisters Ct NW
- 1474 Ranier Loop NW
- 1454 Ranier Loop NW
- 1461 Ranier Loop NW
- 1615 Sisters Ct NW
- 1471 Ranier Loop NW
- 1455 Ranier Loop NW
- 1665 Sisters Ct NW
- 1475 Ranier Loop NW
- 1610 Sisters Ct NW
- 1480 Ranier Loop NW
- 1610 Sisters Ct NW
- 1450 Ranier Loop NW
- 1620 Sisters Ct NW
- 1451 Ranier Loop NW
- 1624 Pelican Ct NW
- 1630 Sisters Ct NW
Your Personal Tour Guide
Ask me questions while you tour the home.