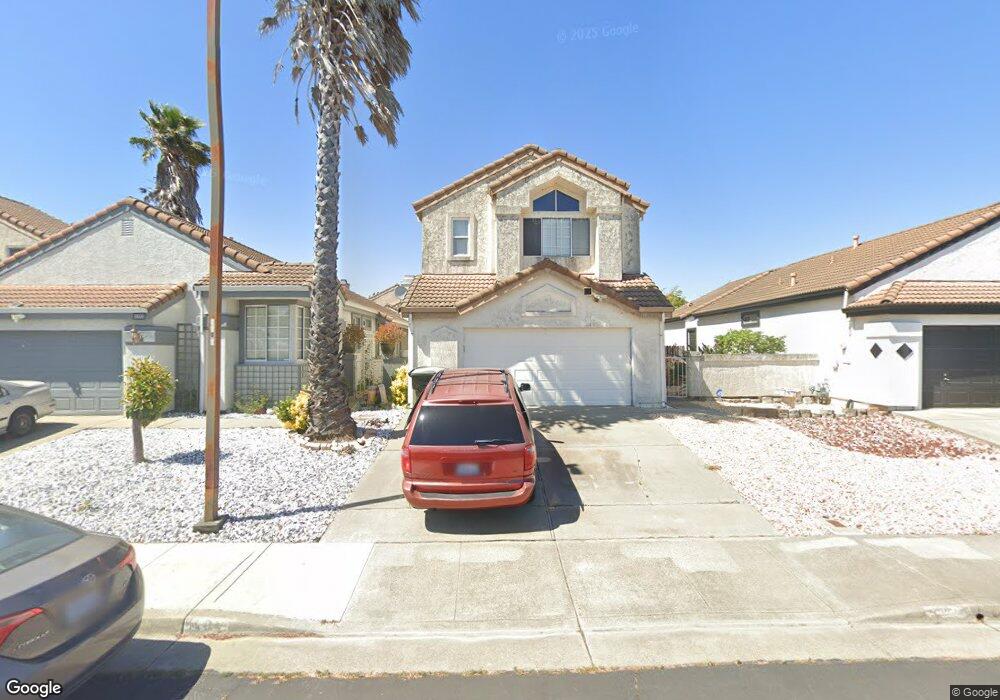
1464 Whitby Way Suisun City, CA 94585
Estimated Value: $541,564 - $607,000
3
Beds
3
Baths
1,666
Sq Ft
$338/Sq Ft
Est. Value
About This Home
This home is located at 1464 Whitby Way, Suisun City, CA 94585 and is currently estimated at $563,641, approximately $338 per square foot. 1464 Whitby Way is a home located in Solano County with nearby schools including Crescent Elementary School, Crystal Middle School, and Armijo High School.
Ownership History
Date
Name
Owned For
Owner Type
Purchase Details
Closed on
Sep 23, 2011
Sold by
Cien Winnie
Bought by
Miller Barry K and Miller Yoko
Current Estimated Value
Home Financials for this Owner
Home Financials are based on the most recent Mortgage that was taken out on this home.
Original Mortgage
$175,600
Outstanding Balance
$119,269
Interest Rate
4.09%
Mortgage Type
New Conventional
Estimated Equity
$444,372
Purchase Details
Closed on
Jun 1, 2005
Sold by
Domingo Romualdo M and Domingo Monica P
Bought by
Cien Winnie
Home Financials for this Owner
Home Financials are based on the most recent Mortgage that was taken out on this home.
Original Mortgage
$368,000
Interest Rate
6.75%
Mortgage Type
New Conventional
Purchase Details
Closed on
May 31, 2005
Sold by
Xaing Qiang Jin
Bought by
Cien Winnie
Home Financials for this Owner
Home Financials are based on the most recent Mortgage that was taken out on this home.
Original Mortgage
$368,000
Interest Rate
6.75%
Mortgage Type
New Conventional
Create a Home Valuation Report for This Property
The Home Valuation Report is an in-depth analysis detailing your home's value as well as a comparison with similar homes in the area
Home Values in the Area
Average Home Value in this Area
Purchase History
| Date | Buyer | Sale Price | Title Company |
|---|---|---|---|
| Miller Barry K | $170,000 | Placer Title Company | |
| Cien Winnie | $460,000 | Placer Title Co | |
| Cien Winnie | -- | Placer Title Co |
Source: Public Records
Mortgage History
| Date | Status | Borrower | Loan Amount |
|---|---|---|---|
| Open | Miller Barry K | $175,600 | |
| Previous Owner | Cien Winnie | $368,000 | |
| Previous Owner | Cien Winnie | $92,000 |
Source: Public Records
Tax History Compared to Growth
Tax History
| Year | Tax Paid | Tax Assessment Tax Assessment Total Assessment is a certain percentage of the fair market value that is determined by local assessors to be the total taxable value of land and additions on the property. | Land | Improvement |
|---|---|---|---|---|
| 2025 | $2,826 | $213,518 | $62,797 | $150,721 |
| 2024 | $2,826 | $209,332 | $61,566 | $147,766 |
| 2023 | $2,747 | $205,228 | $60,359 | $144,869 |
| 2022 | $2,762 | $201,205 | $59,176 | $142,029 |
| 2021 | $2,697 | $197,261 | $58,016 | $139,245 |
| 2020 | $2,848 | $195,240 | $57,422 | $137,818 |
| 2019 | $2,781 | $191,413 | $56,297 | $135,116 |
| 2018 | $2,865 | $187,661 | $55,194 | $132,467 |
| 2017 | $2,901 | $183,982 | $54,112 | $129,870 |
| 2016 | $2,877 | $180,375 | $53,051 | $127,324 |
| 2015 | $2,725 | $177,667 | $52,255 | $125,412 |
| 2014 | $2,705 | $174,188 | $51,232 | $122,956 |
Source: Public Records
Map
Nearby Homes
- 1413 Spence Ct
- 1415 Pelican Way
- 1309 Hall Ln
- 330 Engell Ct
- 301 Childs Ct
- 610 Placer Ln
- 1280 Mayfield Cir
- 603 Woodlark Dr
- 1504 El Morro Ln
- 1201 Deanza Ct
- 607 Crested Dr
- 1416 Prospect Way
- 412 Craven Dr
- 819 Bluejay Dr
- 1109 Canary Dr
- 906 Trumpeter Ct
- 616 Emperor Dr
- 508 Trumpeter Dr
- 808 Pochard Way
- Berryessa Plan at Midway Meadows
- 1460 Whitby Way
- 1468 Whitby Way
- 1472 Whitby Way
- 1456 Whitby Way
- 1437 Tillman St
- 1441 Tillman St
- 1433 Tillman St
- 1452 Whitby Way
- 1476 Whitby Way
- 1445 Tillman St
- 1429 Tillman St
- 1425 Tillman St
- 1449 Tillman St
- 1448 Whitby Way
- 1480 Whitby Way
- 1421 Tillman St
- 1453 Tillman St
- 1444 Whitby Way
- 1484 Whitby Way
- 1457 Tillman St