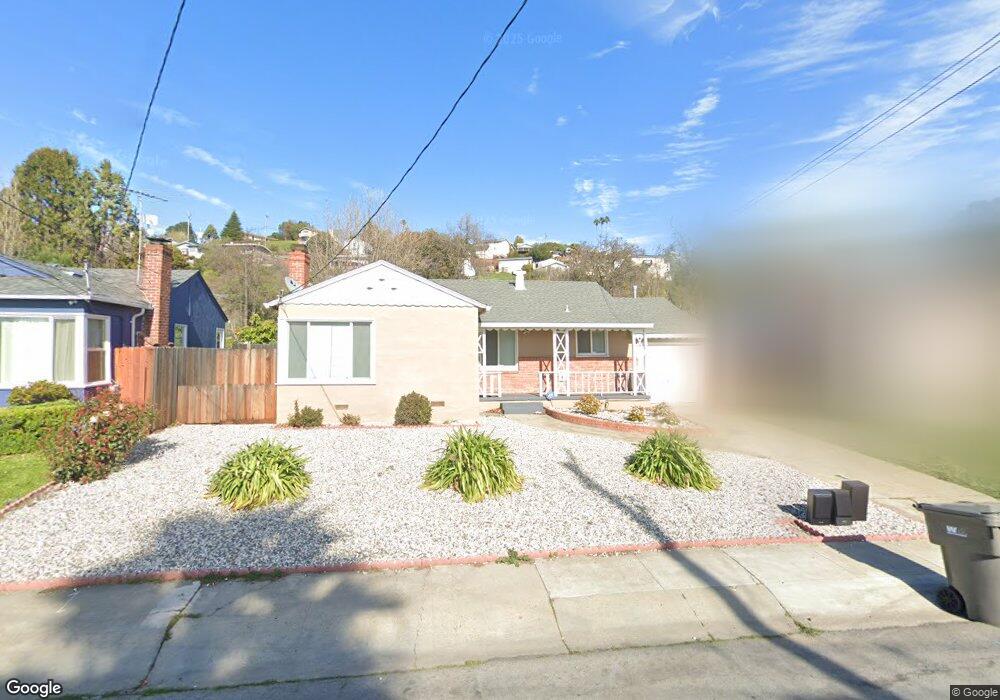
14646 Wake Ave San Leandro, CA 94578
Upper Bal NeighborhoodEstimated Value: $718,000 - $745,878
2
Beds
1
Bath
981
Sq Ft
$745/Sq Ft
Est. Value
About This Home
This home is located at 14646 Wake Ave, San Leandro, CA 94578 and is currently estimated at $731,220, approximately $745 per square foot. 14646 Wake Ave is a home located in Alameda County with nearby schools including Jefferson Elementary School, Bancroft Middle School, and San Leandro High School.
Ownership History
Date
Name
Owned For
Owner Type
Purchase Details
Closed on
Jul 13, 2023
Sold by
Tsang Kwai Tong and Tsang Cindy Poi
Bought by
Tsang Anly Kai Yan and Tang Jevon
Current Estimated Value
Purchase Details
Closed on
Aug 11, 2017
Sold by
T Brothers Investment Llc
Bought by
T Brothers Investment Llc
Home Financials for this Owner
Home Financials are based on the most recent Mortgage that was taken out on this home.
Original Mortgage
$260,000
Interest Rate
3.96%
Mortgage Type
Credit Line Revolving
Purchase Details
Closed on
Feb 3, 2017
Sold by
Eskelson Auralinda V and The Auralinda V Eskelson Revoc
Bought by
T Brothers Investment Llc
Purchase Details
Closed on
Feb 6, 2006
Sold by
Tomberlin Eskelson Auralinda V and Tomberlin Eskelson Auralinda
Bought by
Eskelson Auralinda V and The Auralinda V Eskelson Revoc
Purchase Details
Closed on
Aug 31, 2002
Sold by
Tomberlin James Kelly
Bought by
Eskelson Auralinda Tomberlin
Create a Home Valuation Report for This Property
The Home Valuation Report is an in-depth analysis detailing your home's value as well as a comparison with similar homes in the area
Home Values in the Area
Average Home Value in this Area
Purchase History
| Date | Buyer | Sale Price | Title Company |
|---|---|---|---|
| Tsang Anly Kai Yan | -- | None Listed On Document | |
| Tsang Kwai Tong | -- | None Listed On Document | |
| T Brothers Investment Llc | -- | Fidelity National Title Co | |
| T Brothers Investment Llc | $425,000 | Chicago Title Company | |
| Eskelson Auralinda V | -- | None Available | |
| Eskelson Auralinda Tomberlin | -- | -- |
Source: Public Records
Mortgage History
| Date | Status | Borrower | Loan Amount |
|---|---|---|---|
| Previous Owner | T Brothers Investment Llc | $260,000 |
Source: Public Records
Tax History
| Year | Tax Paid | Tax Assessment Tax Assessment Total Assessment is a certain percentage of the fair market value that is determined by local assessors to be the total taxable value of land and additions on the property. | Land | Improvement |
|---|---|---|---|---|
| 2025 | $10,064 | $780,300 | $234,090 | $546,210 |
| 2024 | $10,064 | $765,000 | $229,500 | $535,500 |
| 2023 | $7,727 | $561,096 | $189,635 | $371,461 |
| 2022 | $7,493 | $550,095 | $185,917 | $364,178 |
| 2021 | $7,282 | $539,311 | $182,272 | $357,039 |
| 2020 | $7,105 | $533,783 | $180,404 | $353,379 |
| 2019 | $6,882 | $523,321 | $176,868 | $346,453 |
| 2018 | $6,689 | $513,060 | $173,400 | $339,660 |
| 2017 | $1,221 | $56,616 | $32,956 | $23,660 |
| 2016 | $1,154 | $55,506 | $32,310 | $23,196 |
| 2015 | $1,127 | $54,672 | $31,824 | $22,848 |
| 2014 | $1,116 | $53,602 | $31,201 | $22,401 |
Source: Public Records
Map
Nearby Homes
- 14644 Saturn Dr
- 0 Saturn Dr
- 14831 Bancroft Ave Unit Space 27
- 14670 Midland Rd
- 2245 Sol St
- 1269 Gabriel Ct
- 14240 Rose Dr
- 0 Montrose Dr
- 15065 Hesperian Blvd Unit 22
- 1592 Oriole Ave
- 1316 135th Ave
- 15675 Liberty St
- 2399 E 14th St Unit 66
- 2399 E 14th St Unit 24
- 2399 E 14th St Unit 112
- 2399 E 14th St Unit 44
- 475 Nabor St
- 1410 Thrush Ave Unit 3
- 824 Maud Ave
- 15933 Cambrian Dr
- 14638 Wake Ave
- 14750 Wake Ave
- 14622 Wake Ave
- 14762 Wake Ave
- 14645 Wake Ave
- 14657 Wake Ave
- 14606 Wake Ave
- 14778 Wake Ave
- 14627 Wake Ave
- 14761 Wake Ave
- 14609 Wake Ave
- 14596 Wake Ave
- 14784 Wake Ave
- 14775 Wake Ave
- 14597 Wake Ave
- 14648 Sylvia Way
- 14582 Wake Ave
- 14626 Sylvia Way
- 14783 Wake Ave
- 14654 Sylvia Way
Your Personal Tour Guide
Ask me questions while you tour the home.