
Seller's Agent in 2025
Nicholas Blickhan
Windermere Real Estate West Sound Inc.
(360) 731-3659
2 in this area
54 Total Sales
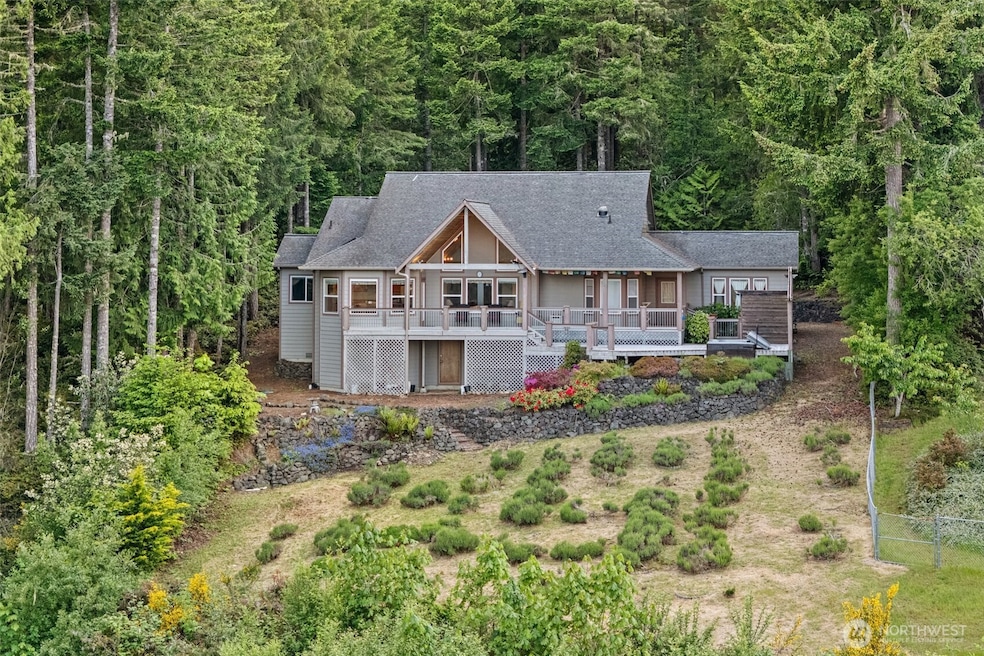
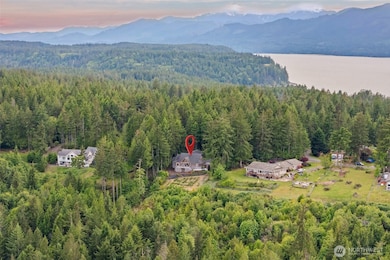
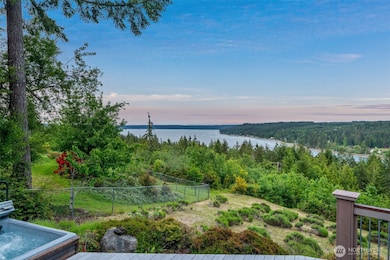
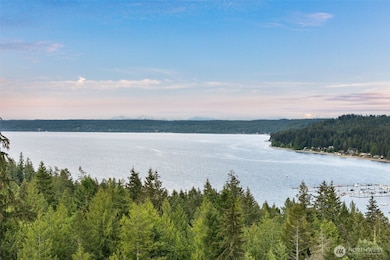
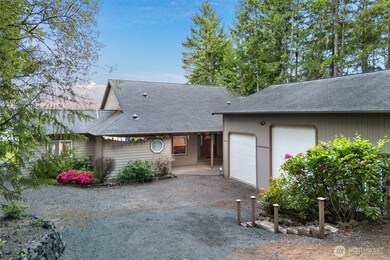
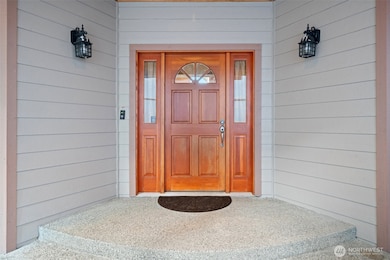
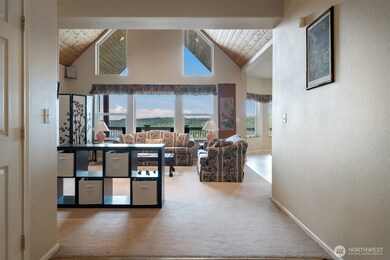
If you're looking for that home that sits above the others come take a look at this NW Contemporary home over looking over Seabeck Bay. This home has a lot of amenities to offer; water views from most of the living areas, large covered decks, open kitchen, and the Hot tub, views from the primary and from the 2nd ensuite at the opposite end of the home. This setting is very private yet has easy access to the Seabeck General store, Olympic View Marina, Seabeck Pizza, Turie's Coffee, the boat launch and Seabeck Scenic beach state park. 20 min to Silverdale and Bremerton. Don't forget the oversize shop/garage with high bay doors to accommodate the toys.
Last Agent to Sell the Property
Windermere RE West Sound Inc. License #24945 Listed on: 05/23/2025
Source: Northwest Multiple Listing Service (NWMLS)
MLS#: 2381083
| Date | Type | Sale Price | Title Company |
|---|---|---|---|
| Warranty Deed | $780,000 | Pacific Northwest Title | |
| Quit Claim Deed | $242,780 | Pacific Nw Title | |
| Warranty Deed | $485,280 | Transnation Title | |
| Warranty Deed | $62,000 | First American Title Ins Co |
| Date | Status | Loan Amount | Loan Type |
|---|---|---|---|
| Open | $663,000 | New Conventional | |
| Previous Owner | $153,900 | Purchase Money Mortgage | |
| Previous Owner | $259,100 | No Value Available |
| Date | Event | Price | Change | Sq Ft Price |
|---|---|---|---|---|
| 09/10/2025 09/10/25 | Sold | $780,000 | -1.9% | $349 / Sq Ft |
| 07/10/2025 07/10/25 | Pending | -- | -- | -- |
| 06/05/2025 06/05/25 | Price Changed | $795,000 | -0.6% | $356 / Sq Ft |
| 05/23/2025 05/23/25 | For Sale | $800,000 | -- | $358 / Sq Ft |
| Year | Tax Paid | Tax Assessment Tax Assessment Total Assessment is a certain percentage of the fair market value that is determined by local assessors to be the total taxable value of land and additions on the property. | Land | Improvement |
|---|---|---|---|---|
| 2026 | $7,539 | $805,210 | $187,920 | $617,290 |
| 2025 | $7,539 | $805,210 | $187,920 | $617,290 |
| 2024 | $7,332 | $805,210 | $187,920 | $617,290 |
| 2023 | $7,032 | $768,370 | $213,660 | $554,710 |
| 2022 | $6,705 | $645,330 | $194,350 | $450,980 |
| 2021 | $6,059 | $553,570 | $155,720 | $397,850 |
| 2020 | $5,591 | $516,190 | $143,650 | $372,540 |
| 2019 | $5,454 | $487,610 | $132,780 | $354,830 |
| 2018 | $5,907 | $382,590 | $98,050 | $284,540 |
| 2017 | $4,914 | $382,590 | $98,050 | $284,540 |
| 2016 | $4,966 | $357,620 | $89,120 | $268,500 |
| 2015 | $4,762 | $357,620 | $89,120 | $268,500 |
| 2014 | -- | $349,050 | $89,120 | $259,930 |
| 2013 | -- | $349,050 | $89,120 | $259,930 |
Seller's Agent in 2025
Nicholas Blickhan
Windermere Real Estate West Sound Inc.
(360) 731-3659
2 in this area
54 Total Sales
Buyer's Agent in 2025
Ian Meis
Keller Williams Greater 360
(360) 301-6909
1 in this area
81 Total Sales
Source: Northwest Multiple Listing Service (NWMLS)
MLS Number: 2381083
APN: 4976-000-004-00-08
Disclaimer: Certain information contained herein is derived from information provided by parties other than Homes.com. All information provided is deemed reliable, but is not guaranteed to be accurate and should be independently verified.
![]() All data is obtained from various sources and may not have been verified by broker or MLS GRID. Supplied Open House Information is subject to change without notice. All information should be independently reviewed and verified for accuracy. Properties may or may not be listed by the office/agent presenting the information. Listing information is provided by the Northwest Multiple Listing Service (NWMLS). Property information is based on available data that may include MLS information, county records, and other sources. Listings marked with the 3 tree icon and provided by NWMLS. All properties are subject to prior sale or withdrawal. IDX information is provided exclusively for consumers’ personal noncommercial use, that it may not be used for any purpose other than to identify prospective properties consumers may be interested in purchasing, that the data is deemed reliable but is not guaranteed by MLS GRID. ©2025 NWMLS.
All data is obtained from various sources and may not have been verified by broker or MLS GRID. Supplied Open House Information is subject to change without notice. All information should be independently reviewed and verified for accuracy. Properties may or may not be listed by the office/agent presenting the information. Listing information is provided by the Northwest Multiple Listing Service (NWMLS). Property information is based on available data that may include MLS information, county records, and other sources. Listings marked with the 3 tree icon and provided by NWMLS. All properties are subject to prior sale or withdrawal. IDX information is provided exclusively for consumers’ personal noncommercial use, that it may not be used for any purpose other than to identify prospective properties consumers may be interested in purchasing, that the data is deemed reliable but is not guaranteed by MLS GRID. ©2025 NWMLS.
Based on information submitted to the MLS GRID