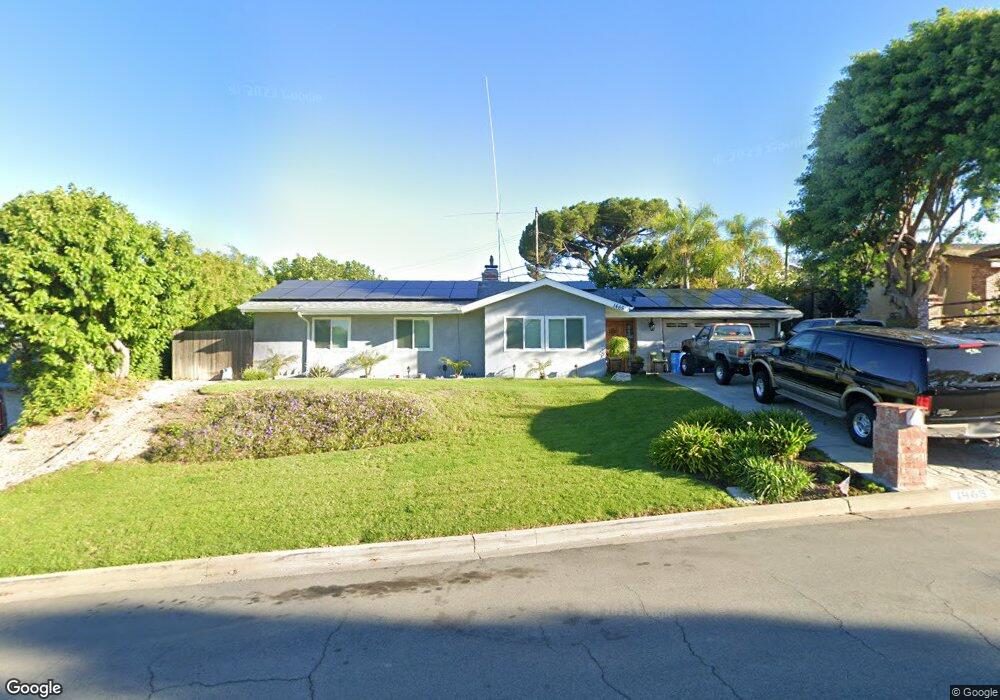
1465 Calle Pimiento Thousand Oaks, CA 91360
Estimated Value: $853,289 - $910,000
3
Beds
2
Baths
1,140
Sq Ft
$768/Sq Ft
Est. Value
About This Home
This home is located at 1465 Calle Pimiento, Thousand Oaks, CA 91360 and is currently estimated at $875,822, approximately $768 per square foot. 1465 Calle Pimiento is a home located in Ventura County with nearby schools including Ladera Stars Academy, Los Cerritos Middle School, and Thousand Oaks High School.
Ownership History
Date
Name
Owned For
Owner Type
Purchase Details
Closed on
Feb 7, 2021
Sold by
Wilson William C and Wilson Christy M
Bought by
Wilson Briian
Current Estimated Value
Purchase Details
Closed on
Jun 23, 2017
Sold by
Wilson Ii William C and Wilson Christy
Bought by
Wilson Ii William C and Wilson Christy M
Purchase Details
Closed on
Mar 22, 2010
Sold by
Weatherman David F and Weatherman Jackie L
Bought by
Wilson Ii William C and Wilson Christy
Home Financials for this Owner
Home Financials are based on the most recent Mortgage that was taken out on this home.
Original Mortgage
$300,000
Interest Rate
5.01%
Mortgage Type
New Conventional
Purchase Details
Closed on
Oct 12, 1998
Sold by
Robert Weatherman and Robert Barbara J
Bought by
Weatherman David F and Weatherman Jackie L
Create a Home Valuation Report for This Property
The Home Valuation Report is an in-depth analysis detailing your home's value as well as a comparison with similar homes in the area
Home Values in the Area
Average Home Value in this Area
Purchase History
| Date | Buyer | Sale Price | Title Company |
|---|---|---|---|
| Wilson Briian | -- | None Available | |
| Wilson Briian | -- | None Listed On Document | |
| Wilson Ii William C | -- | None Available | |
| Wilson Ii William C | $418,000 | Chicago Title Co 72 | |
| Weatherman David F | -- | Old Republic Title Company |
Source: Public Records
Mortgage History
| Date | Status | Borrower | Loan Amount |
|---|---|---|---|
| Previous Owner | Wilson Ii William C | $300,000 |
Source: Public Records
Tax History Compared to Growth
Tax History
| Year | Tax Paid | Tax Assessment Tax Assessment Total Assessment is a certain percentage of the fair market value that is determined by local assessors to be the total taxable value of land and additions on the property. | Land | Improvement |
|---|---|---|---|---|
| 2025 | $6,073 | $539,545 | $269,774 | $269,771 |
| 2024 | $6,073 | $528,966 | $264,484 | $264,482 |
| 2023 | $5,891 | $518,595 | $259,298 | $259,297 |
| 2022 | $7,458 | $668,100 | $434,520 | $233,580 |
| 2021 | $5,690 | $498,458 | $249,229 | $249,229 |
| 2020 | $5,262 | $493,348 | $246,674 | $246,674 |
| 2019 | $5,124 | $483,676 | $241,838 | $241,838 |
| 2018 | $5,022 | $474,194 | $237,097 | $237,097 |
| 2017 | $4,926 | $464,898 | $232,449 | $232,449 |
| 2016 | $4,881 | $455,784 | $227,892 | $227,892 |
| 2015 | $4,796 | $448,940 | $224,470 | $224,470 |
| 2014 | $4,622 | $430,000 | $215,000 | $215,000 |
Source: Public Records
Map
Nearby Homes
- 1373 Calle Crisantemo
- 1455 Calle Tulipan
- 1356 Calle Crisantemo
- 1322 E Avenida de Los Arboles
- 1541 Eucalyptus Cir
- 1764 Shady Brook Dr
- 2847 Cedar Wood Place
- 2961 Ponderosa Cir
- 1669 Woodside Dr
- 2965 Dogwood Cir
- 1233 Calle Pensamiento
- 1534 Holly Ct
- 1540 Holly Ct
- 1546 Holly Ct
- 1449 Calle Durazno
- 1652 Orinda Ct
- 1825 Sweet Briar Place
- 970 Calle Nogal
- 1778 E Avenida de Las Flores Unit 85
- 2001 Brookfield Dr
- 1477 Calle Pimiento
- 1455 Calle Pimiento
- 2635 Calle Limonero
- 1474 Calle Tilo
- 1441 Calle Pimiento
- 1466 Calle Pimiento
- 1456 Calle Pimiento
- 2645 Calle Limonero
- 1478 Calle Pimiento
- 1454 Calle Tilo
- 1444 Calle Pimiento
- 2620 Calle Limonero
- 2630 Calle Limonero
- 1433 Calle Pimiento
- 2655 Calle Limonero
- 1488 Calle Pimiento
- 2610 Calle Limonero
- 1475 Calle Tilo
- 2640 Calle Limonero
- 1434 Calle Pimiento