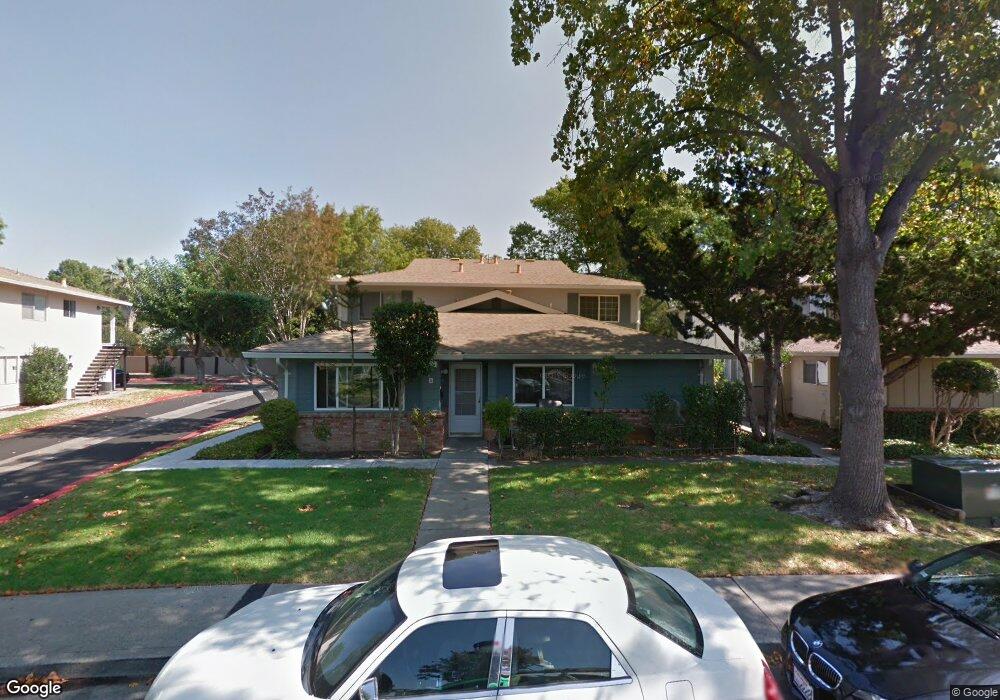
1465 Del Rio Cir Unit A Concord, CA 94518
Tree Haven NeighborhoodEstimated Value: $322,000 - $342,000
2
Beds
1
Bath
861
Sq Ft
$383/Sq Ft
Est. Value
About This Home
This home is located at 1465 Del Rio Cir Unit A, Concord, CA 94518 and is currently estimated at $329,832, approximately $383 per square foot. 1465 Del Rio Cir Unit A is a home located in Contra Costa County with nearby schools including Fair Oaks Elementary School, Oak Grove Middle School, and Ygnacio Valley High School.
Ownership History
Date
Name
Owned For
Owner Type
Purchase Details
Closed on
Nov 16, 2017
Sold by
Zhao Jian and Chiar Maychi
Bought by
Zhao Jian and Chiar Maychi
Current Estimated Value
Purchase Details
Closed on
Apr 20, 2012
Sold by
Lieu Yong Chiar and Liu Xia Bi
Bought by
Zhao Jing Ming
Purchase Details
Closed on
Oct 23, 1998
Sold by
Jim Shahthlen
Bought by
Lieu Yong Chiar and Liu Xia Bi
Home Financials for this Owner
Home Financials are based on the most recent Mortgage that was taken out on this home.
Original Mortgage
$73,250
Interest Rate
6.6%
Mortgage Type
FHA
Purchase Details
Closed on
Sep 24, 1996
Sold by
Gore Alex P and Lin Sumi
Bought by
Jim Shathlen
Create a Home Valuation Report for This Property
The Home Valuation Report is an in-depth analysis detailing your home's value as well as a comparison with similar homes in the area
Home Values in the Area
Average Home Value in this Area
Purchase History
| Date | Buyer | Sale Price | Title Company |
|---|---|---|---|
| Zhao Jian | -- | None Available | |
| Zhao Jian | -- | None Available | |
| Zhao Jing Ming | $85,000 | Pacific Coast Title Company | |
| Lieu Yong Chiar | $79,000 | North American Title Co | |
| Jim Shathlen | $70,000 | Fidelity National Title Co |
Source: Public Records
Mortgage History
| Date | Status | Borrower | Loan Amount |
|---|---|---|---|
| Previous Owner | Lieu Yong Chiar | $73,250 |
Source: Public Records
Tax History Compared to Growth
Tax History
| Year | Tax Paid | Tax Assessment Tax Assessment Total Assessment is a certain percentage of the fair market value that is determined by local assessors to be the total taxable value of land and additions on the property. | Land | Improvement |
|---|---|---|---|---|
| 2025 | $2,092 | $106,752 | $43,956 | $62,796 |
| 2024 | $2,030 | $104,660 | $43,095 | $61,565 |
| 2023 | $2,030 | $102,608 | $42,250 | $60,358 |
| 2022 | $1,977 | $100,597 | $41,422 | $59,175 |
| 2021 | $1,908 | $98,625 | $40,610 | $58,015 |
| 2019 | $1,856 | $95,702 | $39,406 | $56,296 |
| 2018 | $1,772 | $93,827 | $38,634 | $55,193 |
| 2017 | $1,696 | $91,988 | $37,877 | $54,111 |
| 2016 | $1,618 | $90,185 | $37,135 | $53,050 |
| 2015 | $1,565 | $88,832 | $36,578 | $52,254 |
| 2014 | $1,505 | $87,093 | $35,862 | $51,231 |
Source: Public Records
Map
Nearby Homes
- 1459 Del Rio Cir Unit C
- 1040 Mohr Ln Unit C
- 1038 Mohr Ln Unit A
- 134 The Trees Dr
- 1356 Del Rio Cir Unit D
- 1369 Del Rio Cir Unit C
- 1086 Azalea Ln
- 1064 Mohr Ln Unit C
- 1076 Mohr Ln Unit B
- 1096 Mohr Ln
- 1781 Gilardy Dr
- 1091 Mohr Ln Unit D
- 1420 Pear Dr
- 1751 Whitman Rd
- 1024 Bermuda Dr
- 1110 Eureka Ln
- 136 Cleopatra Dr
- 1509 Wicket Ct
- 1271 Hookston Rd
- 1950 Emerald St
- 1465 Del Rio Cir Unit D
- 1465 Del Rio Cir Unit C
- 1465 Del Rio Cir Unit B
- 1465 Del Rio CI Unit A
- 1471 Del Rio Cir Unit D
- 1471 Del Rio Cir Unit C
- 1471 Del Rio Cir Unit B
- 1471 Del Rio Cir Unit A
- 1459 Del Rio Cir
- 1459 Del Rio Cir Unit D
- 1459 Del Rio Cir Unit B
- 1459 Del Rio Cir Unit A
- 1470 Del Rio Cir Unit D
- 1470 Del Rio Cir Unit C
- 1470 Del Rio Cir Unit B
- 1470 Del Rio Cir Unit A
- 1477 Del Rio Cir Unit B
- 1477 Del Rio Cir Unit A
- 1477 Del Rio Cir Unit D
- 1477 Del Rio Cir Unit C