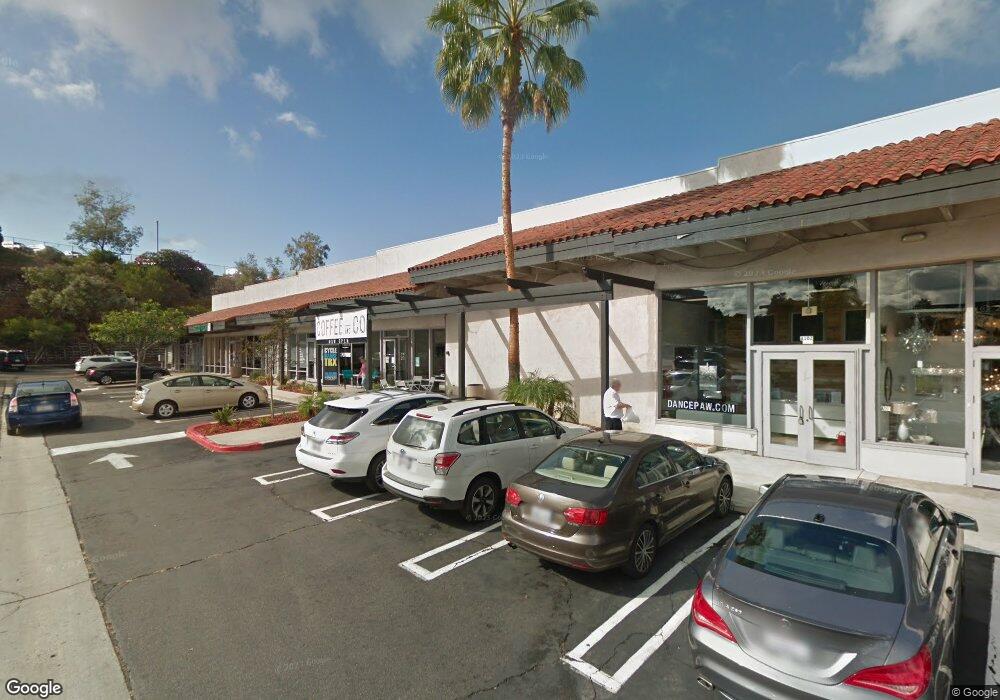
1465 Encinitas Blvd Unit C & D Encinitas, CA 92024
Central Encinitas NeighborhoodEstimated Value: $9,390,765
Studio
--
Bath
16,904
Sq Ft
$556/Sq Ft
Est. Value
About This Home
This home is located at 1465 Encinitas Blvd Unit C & D, Encinitas, CA 92024 and is currently estimated at $9,390,765, approximately $555 per square foot. 1465 Encinitas Blvd Unit C & D is a home located in San Diego County with nearby schools including Ocean Knoll Elementary School, Oak Crest Middle School, and La Costa Canyon High School.
Ownership History
Date
Name
Owned For
Owner Type
Purchase Details
Closed on
Dec 15, 2020
Sold by
Wehrs John M and Wehrs Shirley K
Bought by
Cjej Llc
Current Estimated Value
Home Financials for this Owner
Home Financials are based on the most recent Mortgage that was taken out on this home.
Original Mortgage
$1,450,000
Interest Rate
2.6%
Mortgage Type
Construction
Purchase Details
Closed on
Dec 1, 2020
Sold by
Declaration Of Trust and Wehrs John M
Bought by
Cjej Llc
Home Financials for this Owner
Home Financials are based on the most recent Mortgage that was taken out on this home.
Original Mortgage
$1,450,000
Interest Rate
2.6%
Mortgage Type
Construction
Purchase Details
Closed on
Jun 7, 2001
Sold by
Wehrs John M and Wehrs Shirley K
Bought by
Wehrs John W and Wehrs Shirley K
Purchase Details
Closed on
Jan 29, 2001
Sold by
Encinitas Retail
Bought by
Wehrs John M and Wehrs Shirley K
Home Financials for this Owner
Home Financials are based on the most recent Mortgage that was taken out on this home.
Original Mortgage
$2,050,000
Interest Rate
7.09%
Mortgage Type
Commercial
Create a Home Valuation Report for This Property
The Home Valuation Report is an in-depth analysis detailing your home's value as well as a comparison with similar homes in the area
Home Values in the Area
Average Home Value in this Area
Purchase History
| Date | Buyer | Sale Price | Title Company |
|---|---|---|---|
| Cjej Llc | $6,500,000 | First American Ttl San Diego | |
| Cjej Llc | $6,500,000 | First American Title | |
| Wehrs John W | -- | -- | |
| Wehrs John M | $3,100,000 | Chicago Title |
Source: Public Records
Mortgage History
| Date | Status | Borrower | Loan Amount |
|---|---|---|---|
| Previous Owner | Cjej Llc | $1,450,000 | |
| Previous Owner | Cjej Llc | $1,450,000 | |
| Previous Owner | Wehrs John M | $2,050,000 |
Source: Public Records
Tax History
| Year | Tax Paid | Tax Assessment Tax Assessment Total Assessment is a certain percentage of the fair market value that is determined by local assessors to be the total taxable value of land and additions on the property. | Land | Improvement |
|---|---|---|---|---|
| 2025 | $80,198 | $7,035,808 | $4,329,728 | $2,706,080 |
| 2024 | $80,198 | $6,897,852 | $4,244,832 | $2,653,020 |
| 2023 | $77,749 | $6,762,600 | $4,161,600 | $2,601,000 |
| 2022 | $75,791 | $6,630,000 | $4,080,000 | $2,550,000 |
| 2021 | $52,022 | $4,315,499 | $1,837,566 | $2,477,933 |
| 2020 | $50,994 | $4,271,250 | $1,818,725 | $2,452,525 |
| 2019 | $50,051 | $4,187,501 | $1,783,064 | $2,404,437 |
| 2018 | $49,193 | $4,105,394 | $1,748,102 | $2,357,292 |
| 2017 | $48,405 | $4,024,897 | $1,713,826 | $2,311,071 |
| 2016 | $47,047 | $3,945,978 | $1,680,222 | $2,265,756 |
| 2015 | $46,053 | $3,886,707 | $1,654,984 | $2,231,723 |
| 2014 | $44,875 | $3,810,573 | $1,622,566 | $2,188,007 |
Source: Public Records
Map
Nearby Homes
- 608 Crest Dr
- 349 Horizon Dr
- 301 Hickoryhill Dr
- 1517 Shields Ave
- 1644 Forestdale Dr
- 0 Crest Dr Unit 250045003
- 1642 Blossom Field Way
- 1709 Edgefield Ln
- 1741 Charleston Ln
- 1510 Orangeview Dr Unit 1&2
- 1549 Avenida de Las Adelsas
- 1010 Scarlet Way
- 939 Bluejack Rd
- 1824 Eastwood Ln
- 1733 Gentle Breeze Ln
- 1830 Gatepost Rd
- 1280 Santa fe Dr
- 350 N El Camino Real Unit 78s
- 350 N El Camino Real Unit 72
- 1105 Catania Ct Unit 201
- 1465 Encinitas Blvd
- 1497 Encinitas Blvd
- 201 S El Camino Real
- 1504 Encinitas Blvd
- 104 Camino de Las Flores
- 110 Camino de Las Flores
- 116 Camino de Las Flores
- 122 Camino de Las Flores Unit 1
- 205B S El Camino Real
- 1548 Calle Violetas
- 102 Turner Ave
- 1540 Calle Violetas
- 110 Turner Ave
- 1556 Calle Violetas
- 118 Turner Ave
- 1532 Calle Violetas
- 126 Turner Ave
- 602 Crest Dr
- 592 Crest Dr
- 105 Camino de Las Flores
Your Personal Tour Guide
Ask me questions while you tour the home.