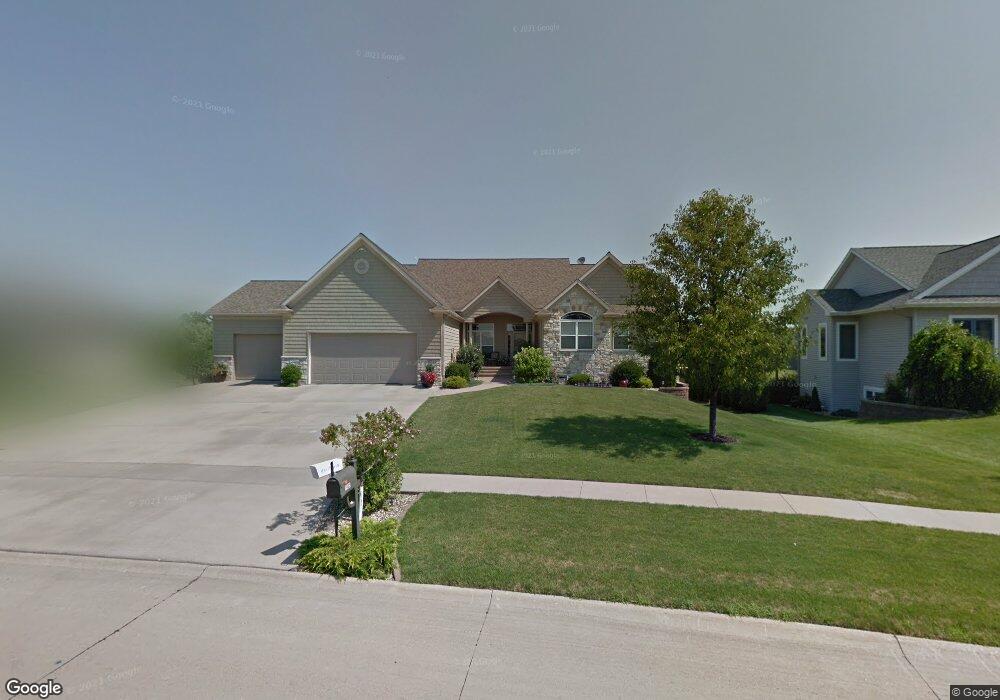
1465 Maple St Robins, IA 52328
Estimated Value: $574,000 - $732,304
5
Beds
3
Baths
2,715
Sq Ft
$241/Sq Ft
Est. Value
About This Home
This home is located at 1465 Maple St, Robins, IA 52328 and is currently estimated at $653,826, approximately $240 per square foot. 1465 Maple St is a home located in Linn County with nearby schools including Nixon Elementary School, Harding Middle School, and John F. Kennedy High School.
Ownership History
Date
Name
Owned For
Owner Type
Purchase Details
Closed on
Aug 4, 2005
Sold by
Midwest Development Co
Bought by
Hendrickson Keven G and Hendrickson Jodi S
Current Estimated Value
Home Financials for this Owner
Home Financials are based on the most recent Mortgage that was taken out on this home.
Original Mortgage
$296,000
Outstanding Balance
$155,493
Interest Rate
5.66%
Mortgage Type
Fannie Mae Freddie Mac
Estimated Equity
$498,333
Purchase Details
Closed on
Feb 6, 2004
Sold by
Houck John J
Bought by
Midwest Development Co
Create a Home Valuation Report for This Property
The Home Valuation Report is an in-depth analysis detailing your home's value as well as a comparison with similar homes in the area
Home Values in the Area
Average Home Value in this Area
Purchase History
| Date | Buyer | Sale Price | Title Company |
|---|---|---|---|
| Hendrickson Keven G | $374,500 | -- | |
| Midwest Development Co | $28,500 | -- |
Source: Public Records
Mortgage History
| Date | Status | Borrower | Loan Amount |
|---|---|---|---|
| Open | Hendrickson Keven G | $296,000 |
Source: Public Records
Tax History
| Year | Tax Paid | Tax Assessment Tax Assessment Total Assessment is a certain percentage of the fair market value that is determined by local assessors to be the total taxable value of land and additions on the property. | Land | Improvement |
|---|---|---|---|---|
| 2025 | $8,544 | $685,900 | $72,200 | $613,700 |
| 2024 | $7,746 | $706,900 | $72,200 | $634,700 |
| 2023 | $7,746 | $643,600 | $72,200 | $571,400 |
| 2022 | $8,238 | $517,200 | $72,200 | $445,000 |
| 2021 | $8,488 | $516,600 | $72,200 | $444,400 |
| 2020 | $8,488 | $493,800 | $72,200 | $421,600 |
| 2019 | $8,360 | $495,200 | $86,700 | $408,500 |
Source: Public Records
Map
Nearby Homes
- 0 Maple St
- 165 Timber Ln
- 9124 Grand Oaks Dr NE
- 70.78 Acres M L Quass Rd
- 8932 Norway Dr NE
- 8926 Norway Dr NE
- 8608 Flatbush Ct NE
- Lot 9 Kervin Ct
- Lot 10 Kervin Ct
- 3230 N Center Point Rd Unit Lot 3
- 804 Palmyra Dr NE
- 8201 Council St NE
- 929 Messina Dr NE
- 1110 Capri Dr NE
- 5466 Silver Ridge Rd
- 207 Meadows Field Dr NE
- 222 Mccarran Ave NE
- 226 Mccarran Ave NE
- 219 Mccarran Ave NE
- 8806 Zeppelin Ave
Your Personal Tour Guide
Ask me questions while you tour the home.