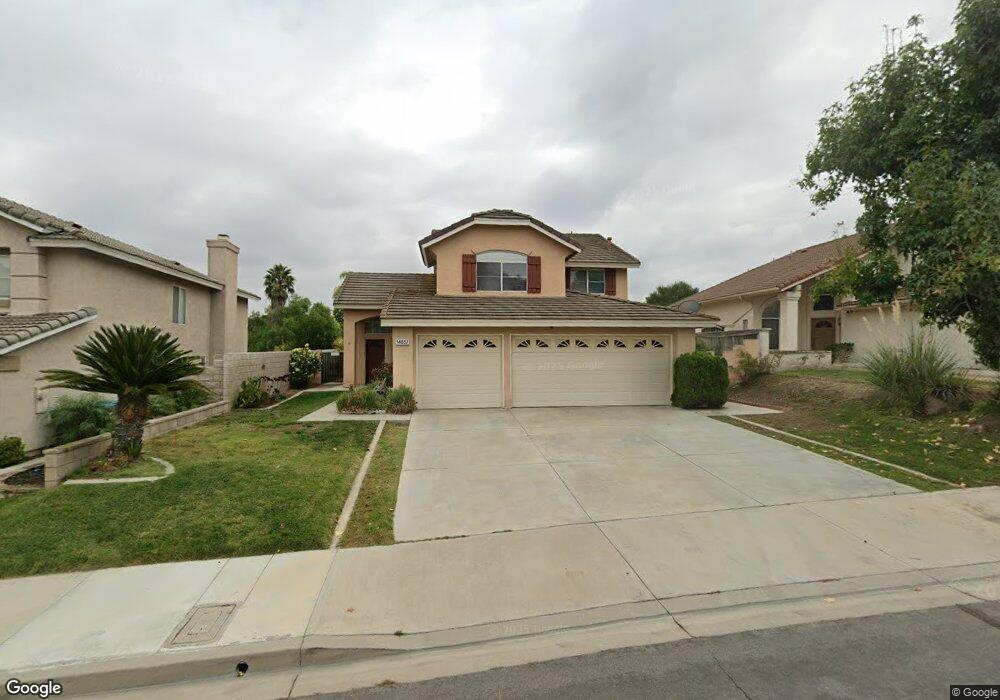
14657 Deep Creek Ct Chino Hills, CA 91709
North Chino Hills NeighborhoodEstimated Value: $1,073,000 - $1,166,000
5
Beds
3
Baths
1,931
Sq Ft
$582/Sq Ft
Est. Value
About This Home
This home is located at 14657 Deep Creek Ct, Chino Hills, CA 91709 and is currently estimated at $1,123,468, approximately $581 per square foot. 14657 Deep Creek Ct is a home located in San Bernardino County with nearby schools including Hidden Trails Elementary School, Canyon Hills Junior High School, and Ruben S. Ayala High School.
Ownership History
Date
Name
Owned For
Owner Type
Purchase Details
Closed on
Oct 24, 2001
Sold by
Goei Tien J
Bought by
Goei Lucy O
Current Estimated Value
Home Financials for this Owner
Home Financials are based on the most recent Mortgage that was taken out on this home.
Original Mortgage
$228,000
Outstanding Balance
$87,551
Interest Rate
6.63%
Estimated Equity
$1,035,917
Purchase Details
Closed on
Oct 22, 2001
Sold by
Chow Thomas L
Bought by
Goei Lucy O and Goei Frank
Home Financials for this Owner
Home Financials are based on the most recent Mortgage that was taken out on this home.
Original Mortgage
$228,000
Outstanding Balance
$87,551
Interest Rate
6.63%
Estimated Equity
$1,035,917
Purchase Details
Closed on
Apr 30, 1999
Sold by
Chow Thomas L
Bought by
Chow Thomas L and Chow Elisa L
Home Financials for this Owner
Home Financials are based on the most recent Mortgage that was taken out on this home.
Original Mortgage
$178,000
Interest Rate
6.94%
Create a Home Valuation Report for This Property
The Home Valuation Report is an in-depth analysis detailing your home's value as well as a comparison with similar homes in the area
Home Values in the Area
Average Home Value in this Area
Purchase History
| Date | Buyer | Sale Price | Title Company |
|---|---|---|---|
| Goei Lucy O | -- | -- | |
| Goei Lucy O | $318,000 | -- | |
| Chow Thomas L | -- | Northern Counties Title Ins |
Source: Public Records
Mortgage History
| Date | Status | Borrower | Loan Amount |
|---|---|---|---|
| Open | Goei Lucy O | $228,000 | |
| Previous Owner | Chow Thomas L | $178,000 |
Source: Public Records
Tax History Compared to Growth
Tax History
| Year | Tax Paid | Tax Assessment Tax Assessment Total Assessment is a certain percentage of the fair market value that is determined by local assessors to be the total taxable value of land and additions on the property. | Land | Improvement |
|---|---|---|---|---|
| 2025 | $5,526 | $469,785 | $163,983 | $305,802 |
| 2024 | $5,526 | $460,574 | $160,768 | $299,806 |
| 2023 | $5,385 | $451,543 | $157,616 | $293,927 |
| 2022 | $5,355 | $442,689 | $154,525 | $288,164 |
| 2021 | $5,259 | $434,009 | $151,495 | $282,514 |
| 2020 | $5,197 | $429,559 | $149,942 | $279,617 |
| 2019 | $5,113 | $421,136 | $147,002 | $274,134 |
| 2018 | $5,610 | $412,879 | $144,120 | $268,759 |
| 2017 | $5,516 | $404,783 | $141,294 | $263,489 |
| 2016 | $5,213 | $396,847 | $138,524 | $258,323 |
| 2015 | $5,118 | $390,886 | $136,443 | $254,443 |
| 2014 | $5,025 | $383,229 | $133,770 | $249,459 |
Source: Public Records
Map
Nearby Homes
- 2286 Black Pine Rd
- 2024 Vista Del Sol
- 14748 Moon Crest Ln Unit E
- 14726 Moon Crest Ln Unit E
- 15030 Camino Arroyo
- 2432 Moon Dust Dr Unit B
- 2417 Brookhaven Dr
- 15075 Avenida Del Monte
- 2460 Windmill Creek Rd
- 1525 Rancho Hills Dr
- 2516 Sundial Dr Unit B
- 14269 Sapphire Hill Ln
- 15036 Calle la Paloma
- 2702 Avenida Marguerite
- 15429 Turquoise Cir N
- 15050 Avenida de Las Flores
- 1850 Fairway Dr Unit 48
- 1850 Fairway Dr Unit 47
- 2891 Galloping Hills Rd
- 2153 Turquoise Cir
- 14665 Deep Creek Ct
- 14649 Deep Creek Ct
- 14708 Silver Spur Ct
- 14673 Deep Creek Ct
- 14641 Deep Creek Ct
- 1997 Big Oak Ave
- 14712 Silver Spur Ct
- 14704 Silver Spur Ct
- 14681 Deep Creek Ct
- 14656 Deep Creek Ct
- 14664 Deep Creek Ct
- 14648 Deep Creek Ct
- 14716 Silver Spur Ct
- 2005 Big Oak Ave
- 14672 Deep Creek Ct
- 14640 Deep Creek Ct
- 14720 Silver Spur Ct
- 14705 Silver Spur Ct
- 1970 Nordic Ave
- 1956 Nordic Ave