Estimated Value: $187,593 - $228,000
3
Beds
2
Baths
1,816
Sq Ft
$114/Sq Ft
Est. Value
About This Home
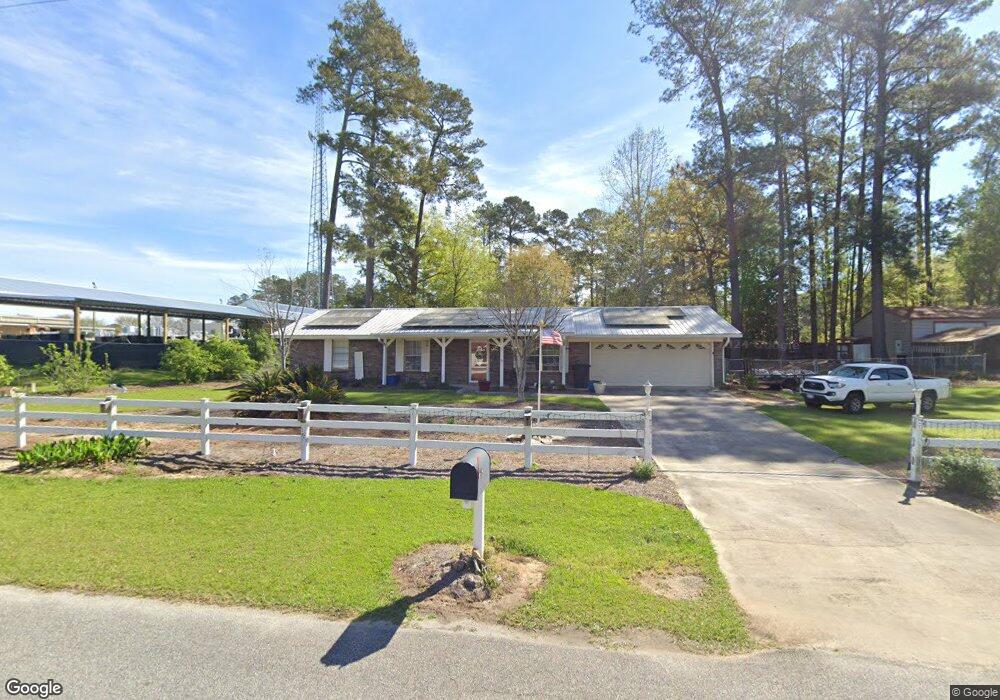
This home is located at 1466 7th St NW, Cairo, GA 39828 and is currently estimated at $206,148, approximately $113 per square foot. 1466 7th St NW is a home located in Grady County with nearby schools including Cairo High School.
Ownership History
Date
Name
Owned For
Owner Type
Purchase Details
Closed on
Feb 17, 2023
Sold by
Castleberry Amy
Bought by
Castleberry Virgil
Current Estimated Value
Purchase Details
Closed on
Feb 11, 2019
Sold by
Castleberry Amy Jo-Ann Black
Bought by
Castleberry Amy Jo-Ann Black and Castleberry Virgil Howard
Purchase Details
Closed on
Apr 17, 2017
Sold by
Castleberry Virgil Howard
Bought by
Black Amy Jo-Anne
Purchase Details
Closed on
Oct 30, 2008
Sold by
Winzell Mark
Bought by
Castleberry Virgil and Castleberry Amy B
Home Financials for this Owner
Home Financials are based on the most recent Mortgage that was taken out on this home.
Original Mortgage
$167,500
Interest Rate
6.11%
Mortgage Type
New Conventional
Purchase Details
Closed on
Dec 3, 2004
Sold by
Harrell Earl R
Bought by
Winzell Mark D
Purchase Details
Closed on
Nov 30, 1973
Sold by
Harrell Earl R
Bought by
Harrell Earl R
Create a Home Valuation Report for This Property
The Home Valuation Report is an in-depth analysis detailing your home's value as well as a comparison with similar homes in the area
Home Values in the Area
Average Home Value in this Area
Purchase History
| Date | Buyer | Sale Price | Title Company |
|---|---|---|---|
| Castleberry Virgil | -- | -- | |
| Castleberry Amy Jo-Ann Black | -- | -- | |
| Black Amy Jo-Anne | -- | -- | |
| Castleberry Virgil | $167,500 | -- | |
| Winzell Mark D | $80,000 | -- | |
| Harrell Earl R | -- | -- |
Source: Public Records
Mortgage History
| Date | Status | Borrower | Loan Amount |
|---|---|---|---|
| Previous Owner | Castleberry Virgil | $167,500 |
Source: Public Records
Tax History Compared to Growth
Tax History
| Year | Tax Paid | Tax Assessment Tax Assessment Total Assessment is a certain percentage of the fair market value that is determined by local assessors to be the total taxable value of land and additions on the property. | Land | Improvement |
|---|---|---|---|---|
| 2024 | $2,588 | $67,158 | $5,520 | $61,638 |
| 2023 | $0 | $54,596 | $12,000 | $42,596 |
| 2022 | $1,956 | $54,596 | $12,000 | $42,596 |
| 2021 | $1,956 | $54,596 | $12,000 | $42,596 |
| 2020 | $1,956 | $54,596 | $12,000 | $42,596 |
| 2019 | $1,939 | $54,117 | $12,000 | $42,117 |
| 2018 | $1,939 | $54,117 | $12,000 | $42,117 |
| 2017 | $0 | $54,117 | $12,000 | $42,117 |
| 2016 | -- | $47,926 | $12,000 | $35,926 |
| 2015 | -- | $47,926 | $12,000 | $35,926 |
| 2014 | -- | $47,926 | $12,000 | $35,926 |
| 2013 | -- | $46,440 | $12,000 | $34,440 |
Source: Public Records
Map
Nearby Homes
- 1490 Magnolia Dr
- 00 6th St NW
- 000 15th Ave Nw -- Tract 1
- 000 15th Ave Nw -- Tract 2
- 698 12th Ave NW
- 1420 Parallel Dr NW
- 1200 15th Ave NW
- 1006 Syrup Mill Creek
- 1002 Syrup Mill Creek
- 1006 Syrup Mill Creek Ln
- 1296 McQuaig St NW
- 220 8th Ave NW
- 1725 Tract 2 Hwy 84w
- 1725 Tract #1 Hwy 84w
- 1500 15th Ave NW
- 00 00 Hwy 111 South Tract 2
- Lot 1 Crine Blvd
- 2975 U S 84
- 125 6th Ave NW
- 1389 Lake Front Dr
- 1465 6th St NW
- 1459 7th St NW
- 1469 7th St NW
- 1455 6th St NW
- 1403 7th St NW
- 1400 7th St NW
- 1472 7th St NW
- 1466 6th St NW
- 1472 6th St NW
- 1456 6th St NW
- 700 14th Ave NW
- 1444 6th St NW
- 1434 6th St NW
- 1465 5th St NW
- 1461 5th St NW
- 1469 5th St NW
- 1453 5th St NW
- 1431 5th St NW
- 708 14th Ave NW
- 1325 6th St NW