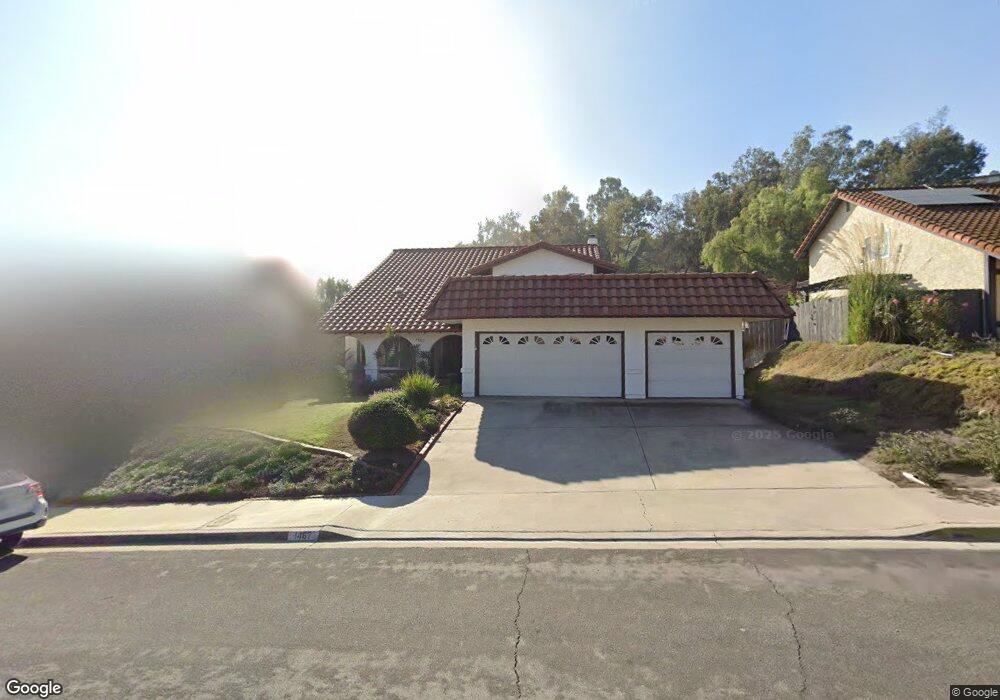
1467 Bathurst Place El Cajon, CA 92020
Fletcher Hills NeighborhoodEstimated Value: $1,043,000 - $1,146,670
4
Beds
3
Baths
2,264
Sq Ft
$487/Sq Ft
Est. Value
About This Home
This home is located at 1467 Bathurst Place, El Cajon, CA 92020 and is currently estimated at $1,102,418, approximately $486 per square foot. 1467 Bathurst Place is a home located in San Diego County with nearby schools including Flying Hills Elementary School, Grossmont High School, and Eje Middle Academy.
Ownership History
Date
Name
Owned For
Owner Type
Purchase Details
Closed on
Dec 16, 2002
Sold by
Quinn William F and Quinn Joanne C
Bought by
Quinn William F and Quinn Joanne C
Current Estimated Value
Purchase Details
Closed on
Sep 30, 2002
Sold by
Quinn William F and Quinn Joanne C
Bought by
Quinn William F and Quinn Joanne C
Home Financials for this Owner
Home Financials are based on the most recent Mortgage that was taken out on this home.
Original Mortgage
$203,000
Interest Rate
5.58%
Purchase Details
Closed on
Dec 17, 2001
Sold by
Quinn William F and Quinn Joanne C
Bought by
Quinn William F and Quinn Joanne C
Purchase Details
Closed on
Sep 3, 1993
Sold by
Petrick Edward Kimberly
Bought by
Quinn William F and Quinn Joanne C
Home Financials for this Owner
Home Financials are based on the most recent Mortgage that was taken out on this home.
Original Mortgage
$190,000
Interest Rate
7.13%
Purchase Details
Closed on
Mar 30, 1987
Create a Home Valuation Report for This Property
The Home Valuation Report is an in-depth analysis detailing your home's value as well as a comparison with similar homes in the area
Home Values in the Area
Average Home Value in this Area
Purchase History
| Date | Buyer | Sale Price | Title Company |
|---|---|---|---|
| Quinn William F | -- | -- | |
| Quinn William F | -- | Fidelity National Title Co | |
| Quinn William F | -- | -- | |
| Quinn William F | $243,000 | -- | |
| Petrick Edward K | -- | United Title | |
| -- | $184,000 | -- |
Source: Public Records
Mortgage History
| Date | Status | Borrower | Loan Amount |
|---|---|---|---|
| Closed | Quinn William F | $203,000 | |
| Closed | Quinn William F | $190,000 |
Source: Public Records
Tax History Compared to Growth
Tax History
| Year | Tax Paid | Tax Assessment Tax Assessment Total Assessment is a certain percentage of the fair market value that is determined by local assessors to be the total taxable value of land and additions on the property. | Land | Improvement |
|---|---|---|---|---|
| 2025 | $5,345 | $412,993 | $94,933 | $318,060 |
| 2024 | $5,345 | $404,896 | $93,072 | $311,824 |
| 2023 | $5,199 | $396,958 | $91,248 | $305,710 |
| 2022 | $5,188 | $389,175 | $89,459 | $299,716 |
| 2021 | $5,166 | $381,545 | $87,705 | $293,840 |
| 2020 | $4,930 | $377,634 | $86,806 | $290,828 |
| 2019 | $4,454 | $370,230 | $85,104 | $285,126 |
| 2018 | $4,381 | $362,972 | $83,436 | $279,536 |
| 2017 | $31 | $355,855 | $81,800 | $274,055 |
| 2016 | $4,149 | $348,879 | $80,197 | $268,682 |
| 2015 | $4,127 | $343,640 | $78,993 | $264,647 |
| 2014 | $4,045 | $336,909 | $77,446 | $259,463 |
Source: Public Records
Map
Nearby Homes
- 1498 Berenda Place
- 370 N Cuyamaca St
- 346 El Monte Rd
- 1280 W Main St Unit 24
- 1280 W Main St Unit 6
- 1673 Hillsmont Dr
- 168 S Pierce St
- 274 S Pierce St Unit 17
- 275 Hihill Way
- 364 Travelodge Dr
- 302 Travelodge Dr
- 1387 Weers St
- 198 Croydon Ln
- 701 El Monte Rd
- 927 W Main St
- 741 N Pierce St
- 1958 Milford Place
- 578 Millar Ave
- 2213 Chatham St
- 540 Cobblestone Ct
- 1455 Bathurst Place
- 1479 Bathurst Place
- 1483 Bathurst Place
- 1385 Hempden Ct
- 1381 Hempden Ct
- 1466 Bathurst Place
- 1454 Bathurst Place
- 1478 Bathurst Place
- 1491 Bathurst Place
- 1377 Hempden Ct
- 1438 Bathurst Place
- 1482 Bathurst Place
- 1517 Bathurst Place
- 1494 Bathurst Place
- 1404 Bathurst Place
- 1380 Hempden Ct
- 1384 Hempden Ct
- 1479 Hillsmont Dr
- 1527 Bathurst Place
- 1486 Berenda Place