Estimated Value: $465,210 - $500,000
4
Beds
3
Baths
1,417
Sq Ft
$341/Sq Ft
Est. Value
About This Home
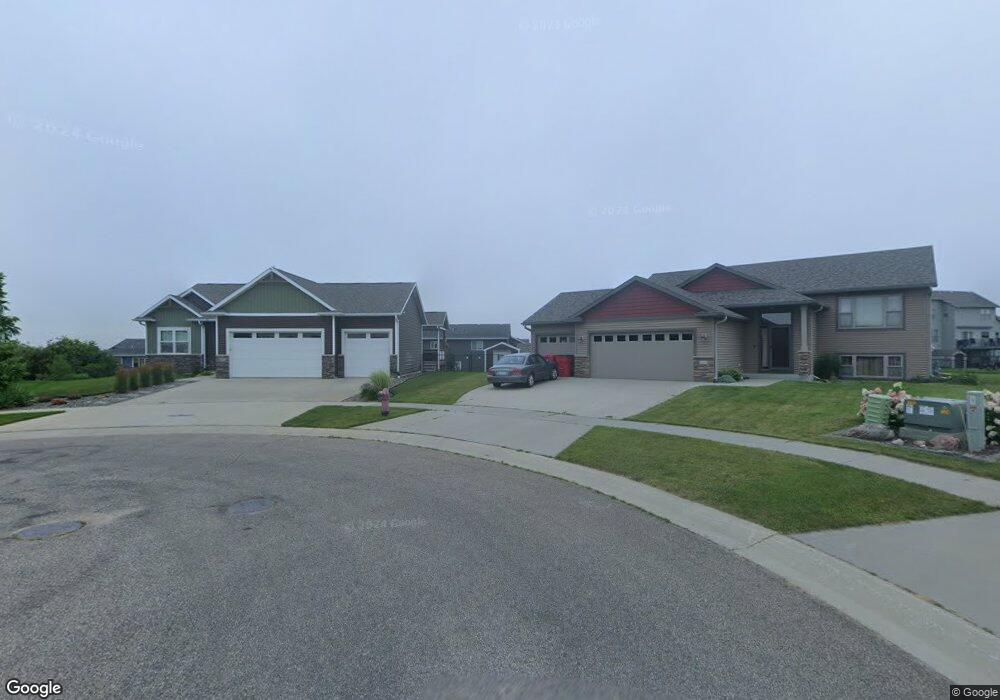
This home is located at 1467 Tunbridge Place NE, Byron, MN 55920 and is currently estimated at $483,053, approximately $340 per square foot. 1467 Tunbridge Place NE is a home with nearby schools including Byron Intermediate School, Byron Middle School, and Byron Senior High School.
Ownership History
Date
Name
Owned For
Owner Type
Purchase Details
Closed on
Sep 11, 2013
Sold by
Petersen Eric M and Petersen Rachel M
Bought by
Peterson Eric M and Petersen Rachel M
Current Estimated Value
Home Financials for this Owner
Home Financials are based on the most recent Mortgage that was taken out on this home.
Original Mortgage
$231,500
Outstanding Balance
$171,630
Interest Rate
4.39%
Mortgage Type
New Conventional
Estimated Equity
$311,423
Purchase Details
Closed on
Oct 10, 2012
Sold by
Byron Other Real Estate Llc
Bought by
Peterson Eric and Peterson Rachel
Home Financials for this Owner
Home Financials are based on the most recent Mortgage that was taken out on this home.
Original Mortgage
$28,685
Interest Rate
3.55%
Mortgage Type
Unknown
Purchase Details
Closed on
Dec 2, 2008
Sold by
Darrel A Farr Development Corp
Bought by
Prosperan Bank and Washington County Bank Na
Create a Home Valuation Report for This Property
The Home Valuation Report is an in-depth analysis detailing your home's value as well as a comparison with similar homes in the area
Home Values in the Area
Average Home Value in this Area
Purchase History
| Date | Buyer | Sale Price | Title Company |
|---|---|---|---|
| Peterson Eric M | -- | Rochester Title | |
| Peterson Eric | $33,751 | Rochester Title & Escrow | |
| Prosperan Bank | -- | None Available |
Source: Public Records
Mortgage History
| Date | Status | Borrower | Loan Amount |
|---|---|---|---|
| Open | Peterson Eric M | $231,500 | |
| Closed | Peterson Eric | $28,685 |
Source: Public Records
Tax History Compared to Growth
Tax History
| Year | Tax Paid | Tax Assessment Tax Assessment Total Assessment is a certain percentage of the fair market value that is determined by local assessors to be the total taxable value of land and additions on the property. | Land | Improvement |
|---|---|---|---|---|
| 2024 | $6,398 | $404,900 | $60,000 | $344,900 |
| 2023 | $6,404 | $405,800 | $60,000 | $345,800 |
| 2022 | $6,748 | $396,400 | $60,000 | $336,400 |
| 2021 | $5,344 | $325,400 | $55,000 | $270,400 |
| 2020 | $5,300 | $318,000 | $55,000 | $263,000 |
| 2019 | $5,206 | $308,200 | $50,000 | $258,200 |
| 2018 | $4,693 | $303,900 | $50,000 | $253,900 |
| 2017 | $4,594 | $277,800 | $45,000 | $232,800 |
| 2016 | $4,326 | $260,100 | $38,100 | $222,000 |
| 2015 | $3,674 | $239,000 | $32,100 | $206,900 |
| 2014 | $340 | $210,300 | $31,500 | $178,800 |
| 2012 | -- | $34,000 | $34,000 | $0 |
Source: Public Records
Map
Nearby Homes
- 1582 Brandt Dr NE
- 1792 (L3,B1) Brandt Dr NE
- 1775 4th St NE
- 1847 4th St NE
- 1799 4th St NE
- 1830 Brandt Dr NE
- 1824 Brandt Dr NE
- 1812 Brandt Dr NE
- 1806 Brandt Dr NE
- 1667 Brandt Dr NE
- 1805 Brandt Dr NE
- 1863 (L13,B2) Robinson Ln NE
- 1886 (L11,B2) Robinson Ln NE
- 1844 (L8,B2) Robinson Ln NE
- 1830 (L7,B2) Robinson Ln NE
- 1860 (L9,B2) Robinson Ln NE
- 1872 (L10,B2) Robinson Ln NE
- 1807 (L14,B2) Robinson Ln NE
- 1705 Brandt Dr NE
- 1732 4th St NE
- 1451 Tunbridge Place NE
- 527 15th Ave NE
- 513 15th Ave NE
- 1468 Tunbridge Place NE
- 543 15th Ave NE
- 1435 Tunbridge Place NE
- 495 15th Ave NE
- 487 15th Ave NE
- 1421 Tunbridge Place NE
- 473 Verwood Ln NE
- 615 Verwood Ln NE
- 561 Verwood Ln NE
- 631 Verwood Ln NE
- 475 15th Ave NE
- 530 15th Ave NE
- 518 15th Ave NE
- 509 Verwood Ln NE
- 1479 4th St NE
- 546 15th Ave NE
- 1495 4th St NE