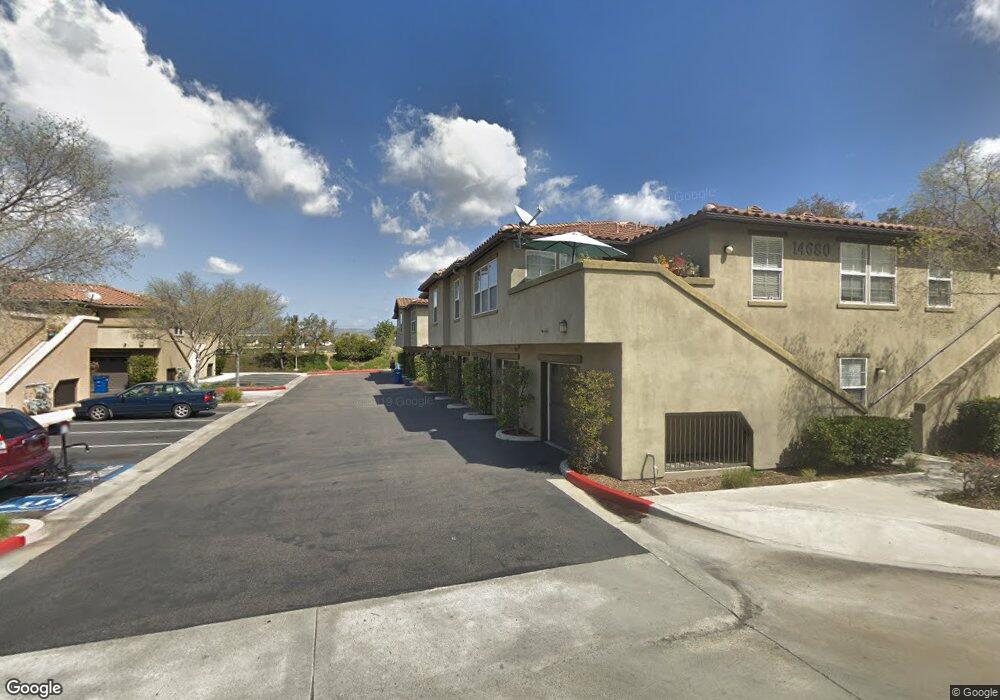
14684 Via Fiesta Unit 8 San Diego, CA 92127
Black Mountain Ranch NeighborhoodEstimated Value: $365,199 - $518,000
2
Beds
1
Bath
822
Sq Ft
$506/Sq Ft
Est. Value
About This Home
This home is located at 14684 Via Fiesta Unit 8, San Diego, CA 92127 and is currently estimated at $416,300, approximately $506 per square foot. 14684 Via Fiesta Unit 8 is a home located in San Diego County with nearby schools including Willow Grove Elementary School, Black Mountain Middle School, and Del Norte High School.
Ownership History
Date
Name
Owned For
Owner Type
Purchase Details
Closed on
Jun 29, 2016
Sold by
Chiulli Alexandra
Bought by
Lopez Eddie
Current Estimated Value
Home Financials for this Owner
Home Financials are based on the most recent Mortgage that was taken out on this home.
Original Mortgage
$148,838
Outstanding Balance
$118,818
Interest Rate
3.58%
Mortgage Type
New Conventional
Estimated Equity
$297,482
Purchase Details
Closed on
May 18, 2012
Sold by
Camarena Erik Raul
Bought by
Chiulli Alexandra
Home Financials for this Owner
Home Financials are based on the most recent Mortgage that was taken out on this home.
Original Mortgage
$77,397
Interest Rate
3.62%
Mortgage Type
New Conventional
Purchase Details
Closed on
May 15, 2006
Sold by
Liu Bingchen and Liu Lihua
Bought by
Camarena Erik Raul
Home Financials for this Owner
Home Financials are based on the most recent Mortgage that was taken out on this home.
Original Mortgage
$130,753
Interest Rate
6.56%
Mortgage Type
Fannie Mae Freddie Mac
Create a Home Valuation Report for This Property
The Home Valuation Report is an in-depth analysis detailing your home's value as well as a comparison with similar homes in the area
Home Values in the Area
Average Home Value in this Area
Purchase History
| Date | Buyer | Sale Price | Title Company |
|---|---|---|---|
| Lopez Eddie | $230,000 | Equity Title San Diego | |
| Chiulli Alexandra | $195,000 | Ticor Title | |
| Camarena Erik Raul | $140,500 | California Title Company |
Source: Public Records
Mortgage History
| Date | Status | Borrower | Loan Amount |
|---|---|---|---|
| Open | Lopez Eddie | $148,838 | |
| Previous Owner | Chiulli Alexandra | $77,397 | |
| Previous Owner | Camarena Erik Raul | $130,753 |
Source: Public Records
Tax History Compared to Growth
Tax History
| Year | Tax Paid | Tax Assessment Tax Assessment Total Assessment is a certain percentage of the fair market value that is determined by local assessors to be the total taxable value of land and additions on the property. | Land | Improvement |
|---|---|---|---|---|
| 2025 | $2,876 | $266,693 | $174,085 | $92,608 |
| 2024 | $2,876 | $261,465 | $170,672 | $90,793 |
| 2023 | $2,816 | $256,339 | $167,326 | $89,013 |
| 2022 | $2,770 | $251,314 | $164,046 | $87,268 |
| 2021 | $2,731 | $246,387 | $160,830 | $85,557 |
| 2020 | $2,710 | $243,861 | $159,181 | $84,680 |
| 2019 | $2,662 | $239,080 | $156,060 | $83,020 |
| 2018 | $2,612 | $234,393 | $153,000 | $81,393 |
| 2017 | $2,564 | $229,798 | $150,000 | $79,798 |
| 2016 | $2,352 | $202,844 | $79,518 | $123,326 |
| 2015 | $2,319 | $199,798 | $78,324 | $121,474 |
| 2014 | $2,267 | $195,885 | $76,790 | $119,095 |
Source: Public Records
Map
Nearby Homes
- 14676 Via Fiesta Unit 5
- 14676 Via Fiesta Unit 2
- 14682 Via Fiesta Unit 9
- 7668 Via Vivaldi
- 14662 Encendido
- 14582 Luna Media
- 14523 Caminito Lazanja
- 14530 Camino de la Luna Unit 1
- 7551 Delfina
- 14773 Via Bettona
- 14522 Las Haciendas
- 7442 Rancho Cabrillo Trail
- 7424 La Mantanza
- 6868 Spyglass Ln
- 7425 Rancho Cabrillo Trail
- 0 Spyglass Ln Unit 39 250035567
- 0 Spyglass Ln Unit 42 250018397
- 6906 Royal Birkdale Place
- 7630 Iluminado
- 7975 Villas
- 14684 Via Fiesta Unit 10
- 14684 Via Fiesta Unit 4
- 14684 Via Fiesta Unit 9
- 14684 Via Fiesta Unit 3
- 14684 Via Fiesta Unit 2
- 14684 Via Fiesta Unit 7
- 14684 Via Fiesta Unit 5
- 14684 Via Fiesta Unit 6
- 14680 Via Fiesta Unit 6
- 14680 Via Fiesta Unit 1
- 14680 Via Fiesta Unit 5
- 14680 Via Fiesta Unit 7
- 14680 Via Fiesta Unit 2
- 14680 Via Fiesta Unit 3
- 14680 Via Fiesta Unit 8
- 14680 Via Fiesta Unit 9
- 14678 Via Fiesta Unit 5
- 14678 Via Fiesta Unit 2
- 14678 Via Fiesta Unit 4
- 14676 Via Fiesta Unit 1