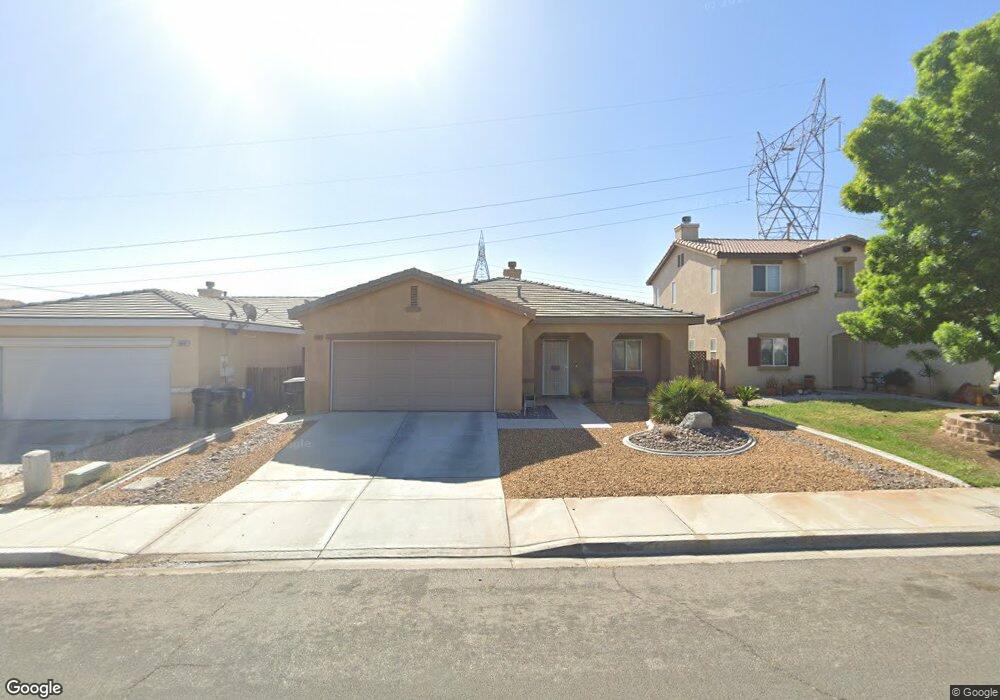
14689 Polo Rd Victorville, CA 92394
Estimated Value: $389,543 - $411,000
4
Beds
2
Baths
1,693
Sq Ft
$239/Sq Ft
Est. Value
About This Home
This home is located at 14689 Polo Rd, Victorville, CA 92394 and is currently estimated at $403,886, approximately $238 per square foot. 14689 Polo Rd is a home located in San Bernardino County with nearby schools including Brentwood Elementary School, Village Elementary School, and Challenger School Of Sports And Fitness.
Ownership History
Date
Name
Owned For
Owner Type
Purchase Details
Closed on
Nov 22, 2010
Sold by
Korby Jamie
Bought by
Korby Jamie L
Current Estimated Value
Home Financials for this Owner
Home Financials are based on the most recent Mortgage that was taken out on this home.
Original Mortgage
$145,955
Outstanding Balance
$97,422
Interest Rate
4.5%
Mortgage Type
FHA
Estimated Equity
$306,464
Purchase Details
Closed on
Nov 12, 2008
Sold by
Wilson Leonard
Bought by
Korby Jamie
Home Financials for this Owner
Home Financials are based on the most recent Mortgage that was taken out on this home.
Original Mortgage
$148,046
Interest Rate
5.9%
Mortgage Type
FHA
Purchase Details
Closed on
Feb 25, 2005
Sold by
Sonrisa Lp
Bought by
Wilson Leonard and Wilson Maria
Home Financials for this Owner
Home Financials are based on the most recent Mortgage that was taken out on this home.
Original Mortgage
$209,900
Interest Rate
5.25%
Mortgage Type
Stand Alone First
Create a Home Valuation Report for This Property
The Home Valuation Report is an in-depth analysis detailing your home's value as well as a comparison with similar homes in the area
Home Values in the Area
Average Home Value in this Area
Purchase History
| Date | Buyer | Sale Price | Title Company |
|---|---|---|---|
| Korby Jamie L | -- | Priority Title | |
| Korby Jamie | $150,000 | Chicago Title Company | |
| Wilson Leonard | $262,500 | Fidelity-Riverside |
Source: Public Records
Mortgage History
| Date | Status | Borrower | Loan Amount |
|---|---|---|---|
| Open | Korby Jamie L | $145,955 | |
| Closed | Korby Jamie | $148,046 | |
| Previous Owner | Wilson Leonard | $209,900 |
Source: Public Records
Tax History Compared to Growth
Tax History
| Year | Tax Paid | Tax Assessment Tax Assessment Total Assessment is a certain percentage of the fair market value that is determined by local assessors to be the total taxable value of land and additions on the property. | Land | Improvement |
|---|---|---|---|---|
| 2025 | $3,247 | $197,029 | $49,258 | $147,771 |
| 2024 | $3,247 | $193,166 | $48,292 | $144,874 |
| 2023 | $3,204 | $189,378 | $47,345 | $142,033 |
| 2022 | $3,147 | $185,665 | $46,417 | $139,248 |
| 2021 | $3,089 | $182,025 | $45,507 | $136,518 |
| 2020 | $3,033 | $180,158 | $45,040 | $135,118 |
| 2019 | $2,979 | $176,626 | $44,157 | $132,469 |
| 2018 | $3,096 | $173,163 | $43,291 | $129,872 |
| 2017 | $3,033 | $169,767 | $42,442 | $127,325 |
| 2016 | $2,972 | $166,438 | $41,610 | $124,828 |
| 2015 | $2,881 | $163,938 | $40,985 | $122,953 |
| 2014 | $2,564 | $128,000 | $26,000 | $102,000 |
Source: Public Records
Map
Nearby Homes
- 14582 Hidden Canyon Ln
- 14577 Crossing Trail
- 14031 Horseshoe Way
- 14780 Butterfly Ct
- 14117 Gopher Canyon Rd
- 13971 Clydesdale Run Ln
- 14433 El Grande Way
- 14470 Green River Rd
- 14304 Gray Fox Ln
- 14993 Brown Ln
- 14115 Buckskin Ct
- 14571 Apache Dr
- 14358 Jackrabbit Ln
- 13720 Dove Ct
- 14766 Shetland Ct
- 14789 Rosemary Dr
- 14416 Honeyhill St
- 14724 Rockrose St
- 15115 Fresh Water Way
- 15121 Sorrel Rd