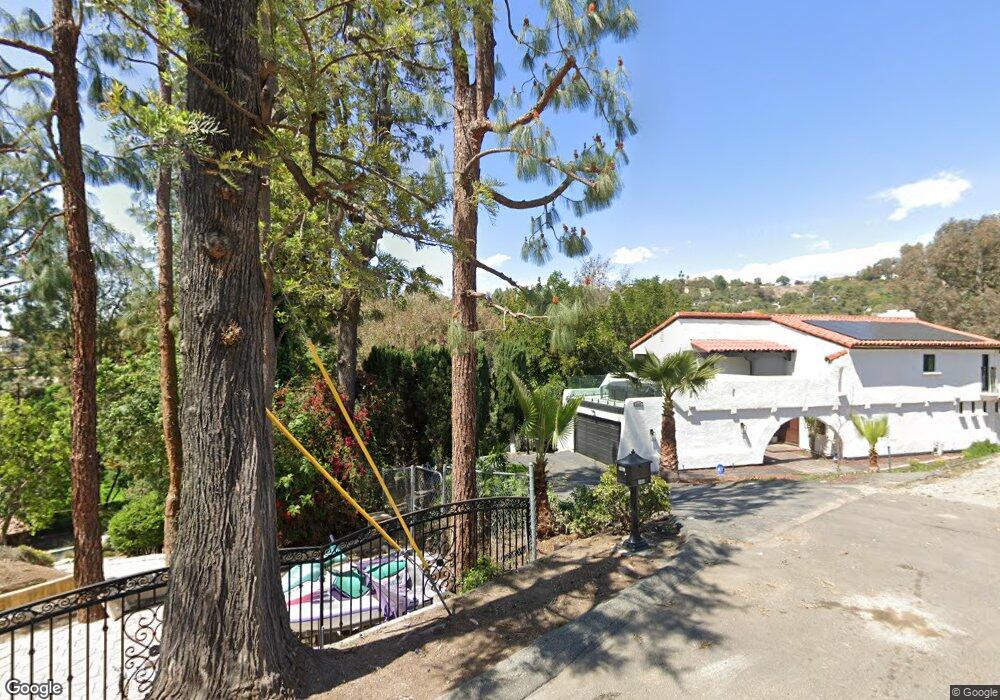
1469 Mayapan Rd La Habra Heights, CA 90631
Estimated Value: $2,001,285 - $2,492,000
6
Beds
5
Baths
5,466
Sq Ft
$409/Sq Ft
Est. Value
About This Home
This home is located at 1469 Mayapan Rd, La Habra Heights, CA 90631 and is currently estimated at $2,234,071, approximately $408 per square foot. 1469 Mayapan Rd is a home located in Los Angeles County with nearby schools including El Portal Elementary School, Rancho-Starbuck Intermediate School, and La Habra High School.
Ownership History
Date
Name
Owned For
Owner Type
Purchase Details
Closed on
Aug 11, 2015
Sold by
Latham Kockinis Teresa L
Bought by
Latham Kockinis Teresa L and Kockinis Thomas C
Current Estimated Value
Home Financials for this Owner
Home Financials are based on the most recent Mortgage that was taken out on this home.
Original Mortgage
$40,000
Outstanding Balance
$31,277
Interest Rate
3.86%
Mortgage Type
Credit Line Revolving
Estimated Equity
$2,202,794
Purchase Details
Closed on
Apr 6, 2005
Sold by
Nylander Robert B
Bought by
Latham Teresa L and Kockinis Md Thomas C
Home Financials for this Owner
Home Financials are based on the most recent Mortgage that was taken out on this home.
Original Mortgage
$926,250
Outstanding Balance
$326,572
Interest Rate
1%
Mortgage Type
Negative Amortization
Estimated Equity
$1,907,499
Purchase Details
Closed on
Dec 14, 1998
Sold by
Nylander Robert B
Bought by
Nylander Robert B and Nylander Karen A
Create a Home Valuation Report for This Property
The Home Valuation Report is an in-depth analysis detailing your home's value as well as a comparison with similar homes in the area
Home Values in the Area
Average Home Value in this Area
Purchase History
| Date | Buyer | Sale Price | Title Company |
|---|---|---|---|
| Latham Kockinis Teresa L | -- | First American Title Company | |
| Latham Teresa L | $1,235,000 | Security Union Title | |
| Nylander Robert B | -- | -- |
Source: Public Records
Mortgage History
| Date | Status | Borrower | Loan Amount |
|---|---|---|---|
| Open | Latham Kockinis Teresa L | $40,000 | |
| Open | Latham Teresa L | $926,250 | |
| Closed | Latham Teresa L | $61,750 |
Source: Public Records
Tax History Compared to Growth
Tax History
| Year | Tax Paid | Tax Assessment Tax Assessment Total Assessment is a certain percentage of the fair market value that is determined by local assessors to be the total taxable value of land and additions on the property. | Land | Improvement |
|---|---|---|---|---|
| 2025 | $19,654 | $1,721,470 | $964,025 | $757,445 |
| 2024 | $19,654 | $1,687,717 | $945,123 | $742,594 |
| 2023 | $19,212 | $1,654,626 | $926,592 | $728,034 |
| 2022 | $19,023 | $1,622,183 | $908,424 | $713,759 |
| 2021 | $18,608 | $1,590,376 | $890,612 | $699,764 |
| 2019 | $18,110 | $1,543,206 | $864,197 | $679,009 |
| 2018 | $17,146 | $1,512,948 | $847,252 | $665,696 |
| 2016 | $16,207 | $1,454,201 | $814,353 | $639,848 |
| 2015 | $15,558 | $1,432,358 | $802,121 | $630,237 |
| 2014 | $13,924 | $1,269,000 | $710,700 | $558,300 |
Source: Public Records
Map
Nearby Homes
- 1445 Darlene Dr
- 161 W Hidden Ln
- 220 Olinda Ave
- 918 Dorothea Rd
- 506 Dorothea Rd
- 1573 Nabal Rd
- 1100 N Euclid St
- 927 E Avocado Crest Rd
- 1500 Kashlan Rd
- 950 N Walnut St
- 770 N Orange St
- 1421 Launer Dr
- 766 N Orange St
- 764 N Orange St
- Plan 4 - The Sage at The Birchwoods
- Plan 2 - The Poppy at The Birchwoods
- 762 N Orange St
- 760 N Orange St
- 1320 Marlei Rd
- 1020 La Serna Ave
- 1467 Mayapan Rd
- 1590 N Walnut St
- 1453 Mayapan Rd
- 1479 Darlene Dr
- 1615 N Walnut St
- 1581 N Walnut St
- 1425 Darlene Dr
- 1550 N Walnut St
- 1556 N Walnut St
- 1665 N Cypress St
- 1445 Mayapan Rd
- 1653 N Cypress St
- 1400 Mayapan Rd
- 1600 N Walnut St
- 1542 N Walnut St
- 1761 N Cypress St
- 1761 N Cypress St
- 1761 1/2 N Cypress St
- 1535 N Walnut St
- 1544 N Walnut St