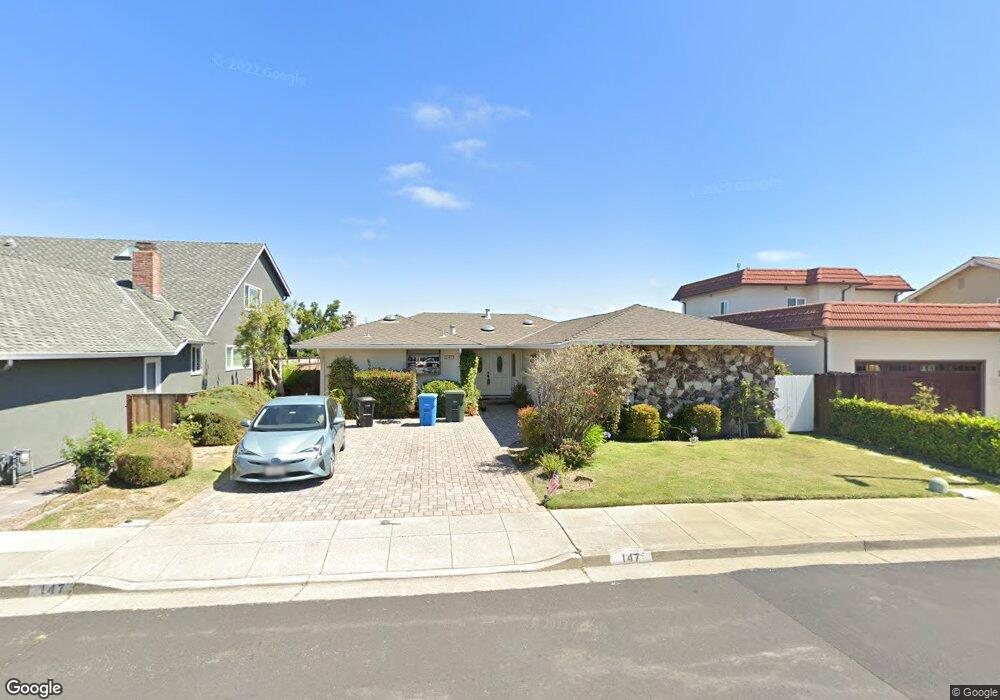
147 Flying Cloud Isle Unit 1 Foster City, CA 94404
Treasure Isle NeighborhoodEstimated Value: $2,154,000 - $2,246,000
3
Beds
2
Baths
1,880
Sq Ft
$1,168/Sq Ft
Est. Value
About This Home
This home is located at 147 Flying Cloud Isle Unit 1, Foster City, CA 94404 and is currently estimated at $2,196,172, approximately $1,168 per square foot. 147 Flying Cloud Isle Unit 1 is a home located in San Mateo County with nearby schools including Brewer Island Elementary School, Bowditch Middle School, and San Mateo High School.
Ownership History
Date
Name
Owned For
Owner Type
Purchase Details
Closed on
Jun 14, 2014
Sold by
Wang Angela C
Bought by
Kotsur Kenneth T and Revocab Grace M Huang
Current Estimated Value
Purchase Details
Closed on
Apr 30, 2013
Sold by
Wang Angela C
Bought by
Kotsur Kenneth T and Huang Grace M
Purchase Details
Closed on
Aug 23, 2011
Sold by
Forbes Brian K and Forbes Adele T
Bought by
Wang Angela C
Purchase Details
Closed on
May 7, 1998
Sold by
Foster Richard H
Bought by
Forbes Brian K and Forbes Adele T
Home Financials for this Owner
Home Financials are based on the most recent Mortgage that was taken out on this home.
Original Mortgage
$440,000
Interest Rate
7.99%
Purchase Details
Closed on
Jan 30, 1995
Sold by
Foster Deanna J
Bought by
Foster Richard H
Create a Home Valuation Report for This Property
The Home Valuation Report is an in-depth analysis detailing your home's value as well as a comparison with similar homes in the area
Home Values in the Area
Average Home Value in this Area
Purchase History
| Date | Buyer | Sale Price | Title Company |
|---|---|---|---|
| Kotsur Kenneth T | $944,000 | None Available | |
| Kotsur Kenneth T | -- | None Available | |
| Wang Angela C | $950,000 | North American Title Co Inc | |
| Forbes Brian K | $262,500 | North American Title Insuran | |
| Foster Richard H | -- | Fidelity National Title | |
| Foster Richard H | -- | Fidelity National Title |
Source: Public Records
Mortgage History
| Date | Status | Borrower | Loan Amount |
|---|---|---|---|
| Previous Owner | Forbes Brian K | $440,000 | |
| Closed | Forbes Brian K | $55,000 |
Source: Public Records
Tax History Compared to Growth
Tax History
| Year | Tax Paid | Tax Assessment Tax Assessment Total Assessment is a certain percentage of the fair market value that is determined by local assessors to be the total taxable value of land and additions on the property. | Land | Improvement |
|---|---|---|---|---|
| 2025 | $20,705 | $1,788,047 | $896,499 | $891,548 |
| 2023 | $20,705 | $1,718,619 | $861,689 | $856,930 |
| 2022 | $20,020 | $1,684,922 | $844,794 | $840,128 |
| 2021 | $19,767 | $1,651,886 | $828,230 | $823,656 |
| 2020 | $19,223 | $1,634,951 | $819,739 | $815,212 |
| 2019 | $18,210 | $1,602,894 | $803,666 | $799,228 |
| 2018 | $17,596 | $1,571,467 | $787,909 | $783,558 |
| 2017 | $17,402 | $1,540,656 | $772,461 | $768,195 |
| 2016 | $17,254 | $1,510,448 | $757,315 | $753,133 |
| 2015 | $16,856 | $1,487,763 | $745,941 | $741,822 |
| 2014 | $11,104 | $976,852 | $490,445 | $486,407 |
Source: Public Records
Map
Nearby Homes
- 650 Pilgrim Dr
- 748 Gull Ave
- 591 Pilgrim Dr
- 3206 Admiralty Ln
- 1102 Admiralty Ln
- 275 Puffin Ct
- 1074 Eagle Ln
- 224 Loon Ct
- 708 Thayer Ln Unit 404
- 769 Eppleton Ln Unit 302
- 1351 Marlin Ave
- 1336 Marlin Ave
- 1028 Foster Square Ln Unit 305
- 708 Eppleton Ln Unit 204
- 718 Eppleton Ln Unit 303
- 241 Bonita Ln
- 926 Lido Ln
- 1018 Lido Ln
- 825 Cortez Ln
- 822 Magellan Ln
- 143 Flying Cloud Isle
- 149 Flying Cloud Isle
- 151 Flying Cloud Isle
- 141 Flying Cloud Isle
- 153 Flying Cloud Isle
- 148 Flying Cloud Isle
- 137 Flying Cloud Isle
- 142 Flying Cloud Isle
- 150 Flying Cloud Isle Unit 1
- 140 Flying Cloud Isle
- 155 Flying Cloud Isle
- 129 Flying Cloud Isle
- 152 Flying Cloud Isle
- 134 Flying Cloud Isle
- 157 Flying Cloud Isle
- 123 Flying Cloud Isle
- 695 Matsonia Dr
- 126 Flying Cloud Isle
- 251 Surfbird Isle
- 687 Matsonia Dr