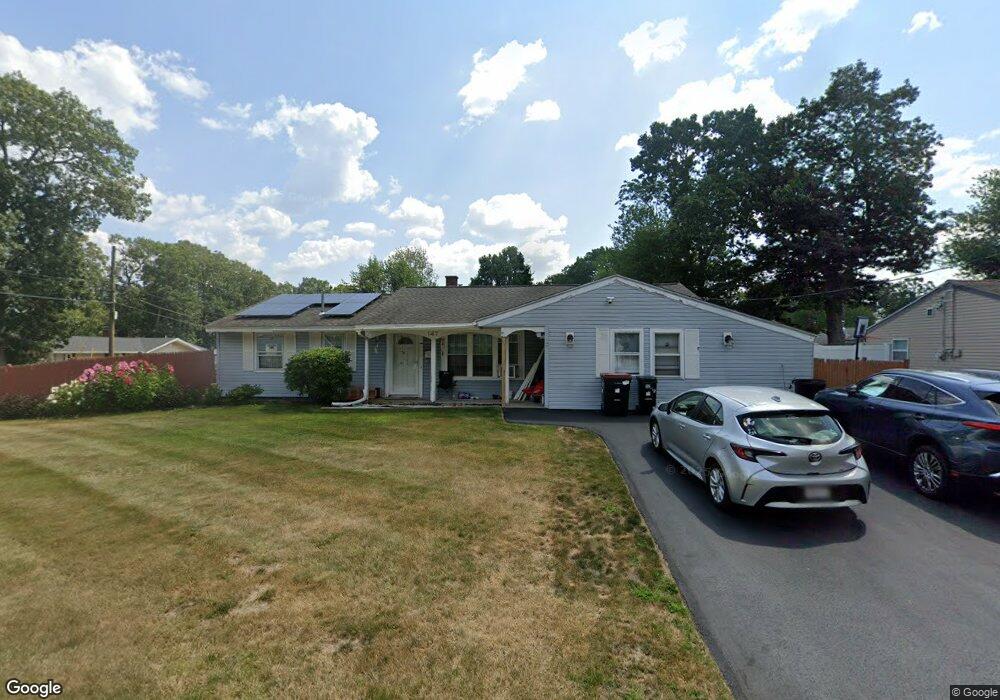
147 Gloucester St Brockton, MA 02302
Estimated Value: $422,000 - $485,000
3
Beds
1
Bath
1,120
Sq Ft
$400/Sq Ft
Est. Value
About This Home
This home is located at 147 Gloucester St, Brockton, MA 02302 and is currently estimated at $448,189, approximately $400 per square foot. 147 Gloucester St is a home located in Plymouth County with nearby schools including Brookfield Elementary School, Mary E. Baker Elementary School, and Downey Elementary School.
Ownership History
Date
Name
Owned For
Owner Type
Purchase Details
Closed on
Dec 28, 1999
Sold by
Porter Oveta E
Bought by
Ghory Mohammad N
Current Estimated Value
Purchase Details
Closed on
Aug 31, 1994
Sold by
25 Laurie Ave Rt
Bought by
Porter Oveta E
Purchase Details
Closed on
May 5, 1993
Sold by
Macdonald Robert W
Bought by
Security Pac Fin Svcs
Create a Home Valuation Report for This Property
The Home Valuation Report is an in-depth analysis detailing your home's value as well as a comparison with similar homes in the area
Purchase History
| Date | Buyer | Sale Price | Title Company |
|---|---|---|---|
| Ghory Mohammad N | $116,600 | -- | |
| Porter Oveta E | $67,100 | -- | |
| Security Pac Fin Svcs | $69,000 | -- |
Source: Public Records
Mortgage History
| Date | Status | Borrower | Loan Amount |
|---|---|---|---|
| Open | Security Pac Fin Svcs | $50,000 | |
| Open | Security Pac Fin Svcs | $115,000 | |
| Closed | Security Pac Fin Svcs | $100,000 |
Source: Public Records
Tax History
| Year | Tax Paid | Tax Assessment Tax Assessment Total Assessment is a certain percentage of the fair market value that is determined by local assessors to be the total taxable value of land and additions on the property. | Land | Improvement |
|---|---|---|---|---|
| 2025 | $4,817 | $397,800 | $144,800 | $253,000 |
| 2024 | $4,608 | $383,400 | $144,800 | $238,600 |
| 2023 | $4,483 | $345,400 | $109,800 | $235,600 |
| 2022 | $4,296 | $307,500 | $99,800 | $207,700 |
| 2021 | $3,954 | $272,700 | $94,300 | $178,400 |
| 2020 | $3,900 | $257,400 | $90,400 | $167,000 |
| 2019 | $3,874 | $249,300 | $84,700 | $164,600 |
| 2018 | $3,562 | $221,800 | $84,700 | $137,100 |
| 2017 | $3,054 | $189,700 | $84,700 | $105,000 |
| 2016 | $2,890 | $166,500 | $80,700 | $85,800 |
| 2015 | $2,788 | $153,600 | $80,700 | $72,900 |
| 2014 | $2,843 | $156,800 | $80,700 | $76,100 |
Source: Public Records
Map
Nearby Homes
- 111 Ames Rd
- 135 Guild Rd
- 2 Dundee St
- 43 Pinehurst Ave
- 11 Russell Rd
- 76 Short St
- 82 Debbie Rd Unit Lot 18
- 34 Guild Rd
- 963 Court St
- 95 Royal Rd
- 35 Errol Rd
- 383 Quincy St
- 5 Debbie Rd
- 101 Regent Rd
- 877 Brockton Ave Unit 877
- 854 Brockton Ave
- 104 Crestfield Dr
- 51 Sterling Rd
- 58 Budd Ave
- 40 Austin Ct Unit Lot 3
Your Personal Tour Guide
Ask me questions while you tour the home.