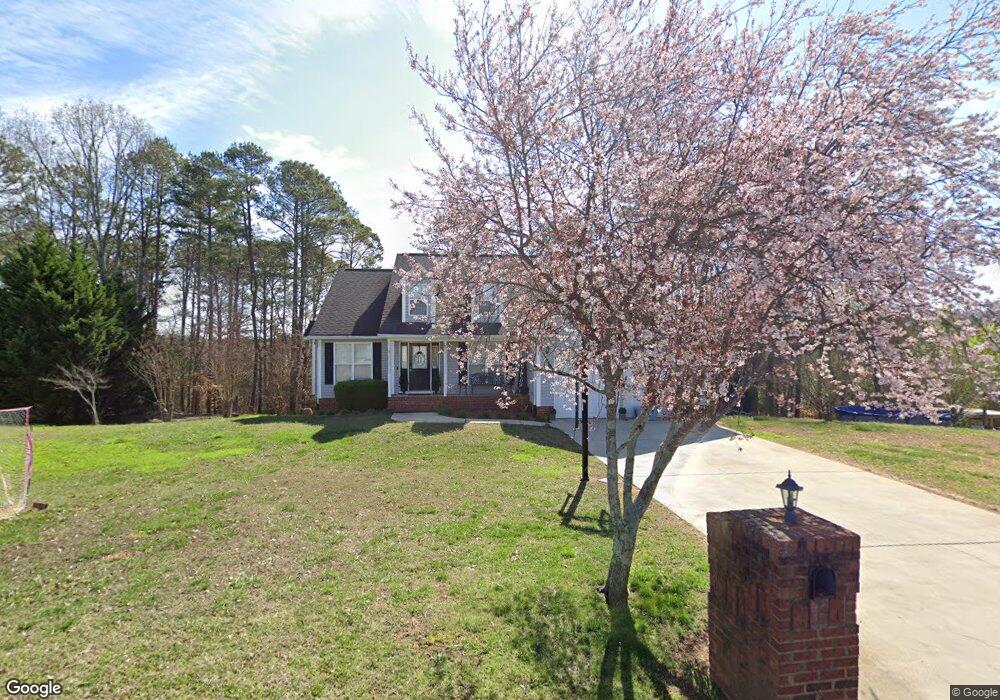
147 Pebblestone Dr La Fayette, GA 30728
Noble NeighborhoodEstimated Value: $274,000 - $356,000
5
Beds
3
Baths
2,668
Sq Ft
$116/Sq Ft
Est. Value
About This Home
This home is located at 147 Pebblestone Dr, La Fayette, GA 30728 and is currently estimated at $309,187, approximately $115 per square foot. 147 Pebblestone Dr is a home located in Walker County with nearby schools including Rock Spring Elementary School and Lafayette High School.
Ownership History
Date
Name
Owned For
Owner Type
Purchase Details
Closed on
Dec 7, 2011
Bought by
Daniel Jared Wade
Current Estimated Value
Home Financials for this Owner
Home Financials are based on the most recent Mortgage that was taken out on this home.
Original Mortgage
$106,632
Outstanding Balance
$73,118
Interest Rate
4.06%
Mortgage Type
New Conventional
Estimated Equity
$236,069
Purchase Details
Closed on
Jun 1, 2010
Sold by
Pnc Bnak National Associat
Bought by
Sec Dept Of Housing
Purchase Details
Closed on
May 19, 2004
Sold by
Bowman Construction Inc
Bought by
Romero Richard A
Purchase Details
Closed on
Oct 2, 2003
Sold by
Hunt-Maples Llc
Bought by
Bowman Construction Inc
Purchase Details
Closed on
Aug 1, 2002
Bought by
Hunt-Maples Llc
Create a Home Valuation Report for This Property
The Home Valuation Report is an in-depth analysis detailing your home's value as well as a comparison with similar homes in the area
Home Values in the Area
Average Home Value in this Area
Purchase History
| Date | Buyer | Sale Price | Title Company |
|---|---|---|---|
| Daniel Jared Wade | $102,000 | -- | |
| Sec Dept Of Housing | $158,230 | -- | |
| Pnc Bnak National Association | $158,230 | -- | |
| Romero Richard A | $157,000 | -- | |
| Bowman Construction Inc | $22,000 | -- | |
| Hunt-Maples Llc | $155,000 | -- |
Source: Public Records
Mortgage History
| Date | Status | Borrower | Loan Amount |
|---|---|---|---|
| Open | Pnc Bnak National Association | $106,632 |
Source: Public Records
Tax History Compared to Growth
Tax History
| Year | Tax Paid | Tax Assessment Tax Assessment Total Assessment is a certain percentage of the fair market value that is determined by local assessors to be the total taxable value of land and additions on the property. | Land | Improvement |
|---|---|---|---|---|
| 2024 | $2,482 | $111,620 | $8,800 | $102,820 |
| 2023 | $2,417 | $106,308 | $8,800 | $97,508 |
| 2022 | $2,340 | $94,091 | $8,800 | $85,291 |
| 2021 | $2,223 | $80,446 | $8,800 | $71,646 |
| 2020 | $2,023 | $70,032 | $8,800 | $61,232 |
| 2019 | $2,061 | $70,032 | $8,800 | $61,232 |
| 2018 | $1,853 | $70,032 | $8,800 | $61,232 |
| 2017 | $2,252 | $70,032 | $8,800 | $61,232 |
| 2016 | $1,844 | $70,032 | $8,800 | $61,232 |
| 2015 | $1,827 | $65,160 | $8,800 | $56,360 |
| 2014 | $1,709 | $65,160 | $8,800 | $56,360 |
| 2013 | -- | $65,160 | $8,800 | $56,360 |
Source: Public Records
Map
Nearby Homes
- 0 Veeler Rd Unit 1522679
- 0 Veeler Rd Unit 10628696
- 11 Willow Cir
- The Pearson Plan at Laurel Ridge
- The Benson II Plan at Laurel Ridge
- The Langford Plan at Laurel Ridge
- The Lawson Plan at Laurel Ridge
- The Coleman Plan at Laurel Ridge
- The McGinnis Plan at Laurel Ridge
- The Caldwell Plan at Laurel Ridge
- 16 Willow Cir
- 329 Lynn Trail
- 23 Willow Cir
- 15 Willow Cir
- 3688 Straight Gut Rd
- 4654 Us Highway 27
- 10180 Us Highway 27
- 4582 Highway N 27
- 4544 N Highway 27
- 701 Bicentennial Trail
- 147 Pebblestone Dr Unit 99999
- 11 Flatstone Dr
- 123 Pebblestone Dr
- 51 Flatstone Dr
- 172 Pebblestone Dr
- 138 Pebblestone Dr
- 113 Pebblestone Dr
- 0 Flatstone Dr Unit 8507646
- 0 Flatstone Dr Unit 8313231
- 116 Pebblestone Dr
- 166 Pebblestone Dr
- 14 Flatstone Dr
- 186 Pebblestone Dr
- 44 Flatstone Dr
- 52 Flatstone Dr
- 96 Pebblestone Dr
- 216 Pebblestone Dr
- 241 Pebblestone Dr
- 75 Pebblestone Dr
- 78 Pebblestone Dr