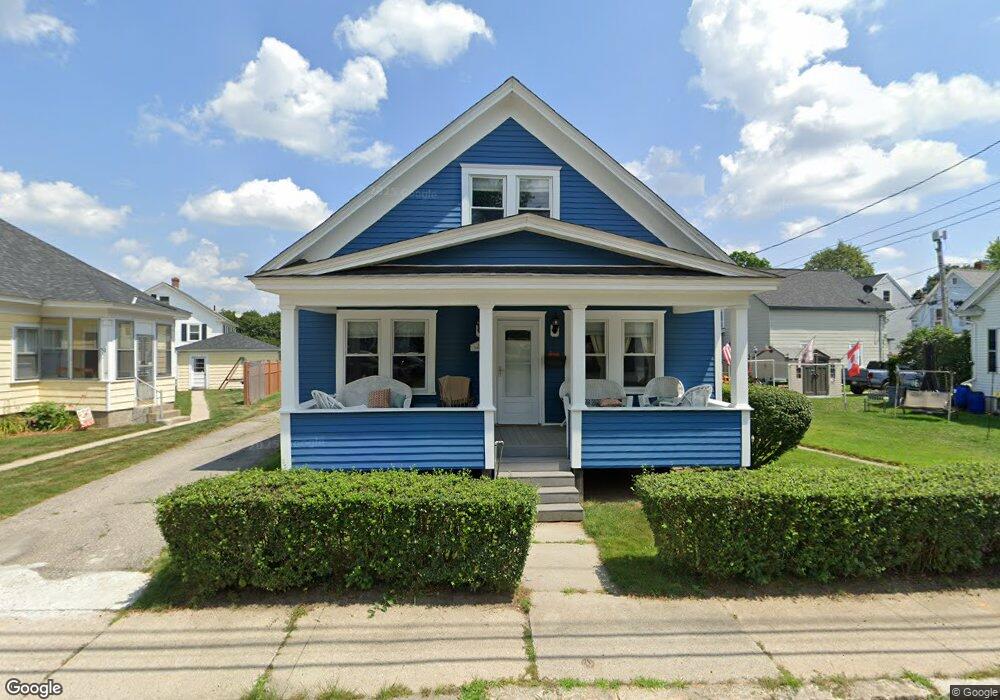
147 Tolles St Nashua, NH 03064
North End Nashua NeighborhoodEstimated Value: $374,000 - $438,213
2
Beds
1
Bath
1,090
Sq Ft
$373/Sq Ft
Est. Value
About This Home
This home is located at 147 Tolles St, Nashua, NH 03064 and is currently estimated at $407,053, approximately $373 per square foot. 147 Tolles St is a home located in Hillsborough County with nearby schools including Mount Pleasant Elementary School, Pennichuck Middle School, and Nashua High School North.
Ownership History
Date
Name
Owned For
Owner Type
Purchase Details
Closed on
Mar 10, 2015
Sold by
Putnam Jeanine F
Bought by
Putnam Ft and Putnam
Current Estimated Value
Purchase Details
Closed on
Oct 26, 1998
Sold by
Heil Paul A
Bought by
Putnam Dennis and Putnam Jeanine F
Home Financials for this Owner
Home Financials are based on the most recent Mortgage that was taken out on this home.
Original Mortgage
$97,444
Interest Rate
6.74%
Mortgage Type
Purchase Money Mortgage
Create a Home Valuation Report for This Property
The Home Valuation Report is an in-depth analysis detailing your home's value as well as a comparison with similar homes in the area
Home Values in the Area
Average Home Value in this Area
Purchase History
| Date | Buyer | Sale Price | Title Company |
|---|---|---|---|
| Putnam Ft | -- | -- | |
| Putnam Dennis | $97,500 | -- |
Source: Public Records
Mortgage History
| Date | Status | Borrower | Loan Amount |
|---|---|---|---|
| Previous Owner | Putnam Dennis | $69,203 | |
| Previous Owner | Putnam Dennis | $97,444 |
Source: Public Records
Tax History Compared to Growth
Tax History
| Year | Tax Paid | Tax Assessment Tax Assessment Total Assessment is a certain percentage of the fair market value that is determined by local assessors to be the total taxable value of land and additions on the property. | Land | Improvement |
|---|---|---|---|---|
| 2024 | $6,055 | $380,800 | $126,200 | $254,600 |
| 2023 | $5,948 | $326,300 | $101,000 | $225,300 |
| 2022 | $5,896 | $326,300 | $101,000 | $225,300 |
| 2021 | $5,067 | $218,200 | $67,300 | $150,900 |
| 2020 | $4,807 | $212,600 | $67,300 | $145,300 |
| 2019 | $4,626 | $212,600 | $67,300 | $145,300 |
| 2018 | $4,509 | $212,600 | $67,300 | $145,300 |
| 2017 | $4,436 | $172,000 | $67,900 | $104,100 |
| 2016 | $4,312 | $172,000 | $67,900 | $104,100 |
| 2015 | $4,219 | $172,000 | $67,900 | $104,100 |
| 2014 | $4,137 | $172,000 | $67,900 | $104,100 |
Source: Public Records
Map
Nearby Homes
- 46 Perham St Unit 214
- 19 Atherton Ave
- 15 Atherton Ave
- 13 Sapphire Ln
- 71 Concord St
- 36-38 Courtland St
- 21 Edson St
- 9 Doveton Ln Unit B
- 73 Berkeley St
- 4 Reservoir St
- 434 Abbott Farm Ln
- 312 Abbott Farm Ln
- 19 Bartlett Ave
- 11 Charles St
- 31 Juliana Ave
- 31 Juliana Ave Unit 4
- 4 Chase St
- 11 Juliana Ave Unit 52
- 3 Opal Way Unit 3
- 1 Opal Way Unit 1